Planning In Numbers 2024
Introduction
‘Planning in Numbers’ provides a strategic review of key trends and outputs during 2024, and a comparison of patterns over the last six years where figures are available for that period.
Planning in Numbers uses data from statistics published by the Central Statistics Office (CSO), the National Oversight and Audit Commission (NOAC), the Department of Housing, Local Government and Heritage (DHLGH) and An Coimisiún Pleanála* (ACP).
This analysis focuses on key indicators directly related to functions such as forward planning, development management, planning appeals, planning enforcement, land activation, vacancy, legal challenges, and the costs of operating local authority planning functions, as presented in the previous series.
The figures presented in the analyses are rounded to one decimal place.
*Part 17, Section 495(3) of the Planning and Development Act 2024 provides that references in any enactment, legal proceedings or document to An Bord Pleanála shall, on and after the commencement of this section, be construed as references to An Coimisiún Pleanála.
Statutory Plans
The total number of submissions made by OPR in 2024 is 56, of which 16 related to city/county development plans (CDPs) and 40 to local area plans (LAPs). The highest number of notifications related to city/county development plans was 12, relating to variations. Regarding local area plans, the highest number was 14, corresponding to a draft plan.
In 2024, 26 plan adoptions were recorded. Two CDPs were adopted, and nine variations were made. Twelve of the adopted plans were LAPs, and three were amendments.
Planning Applications
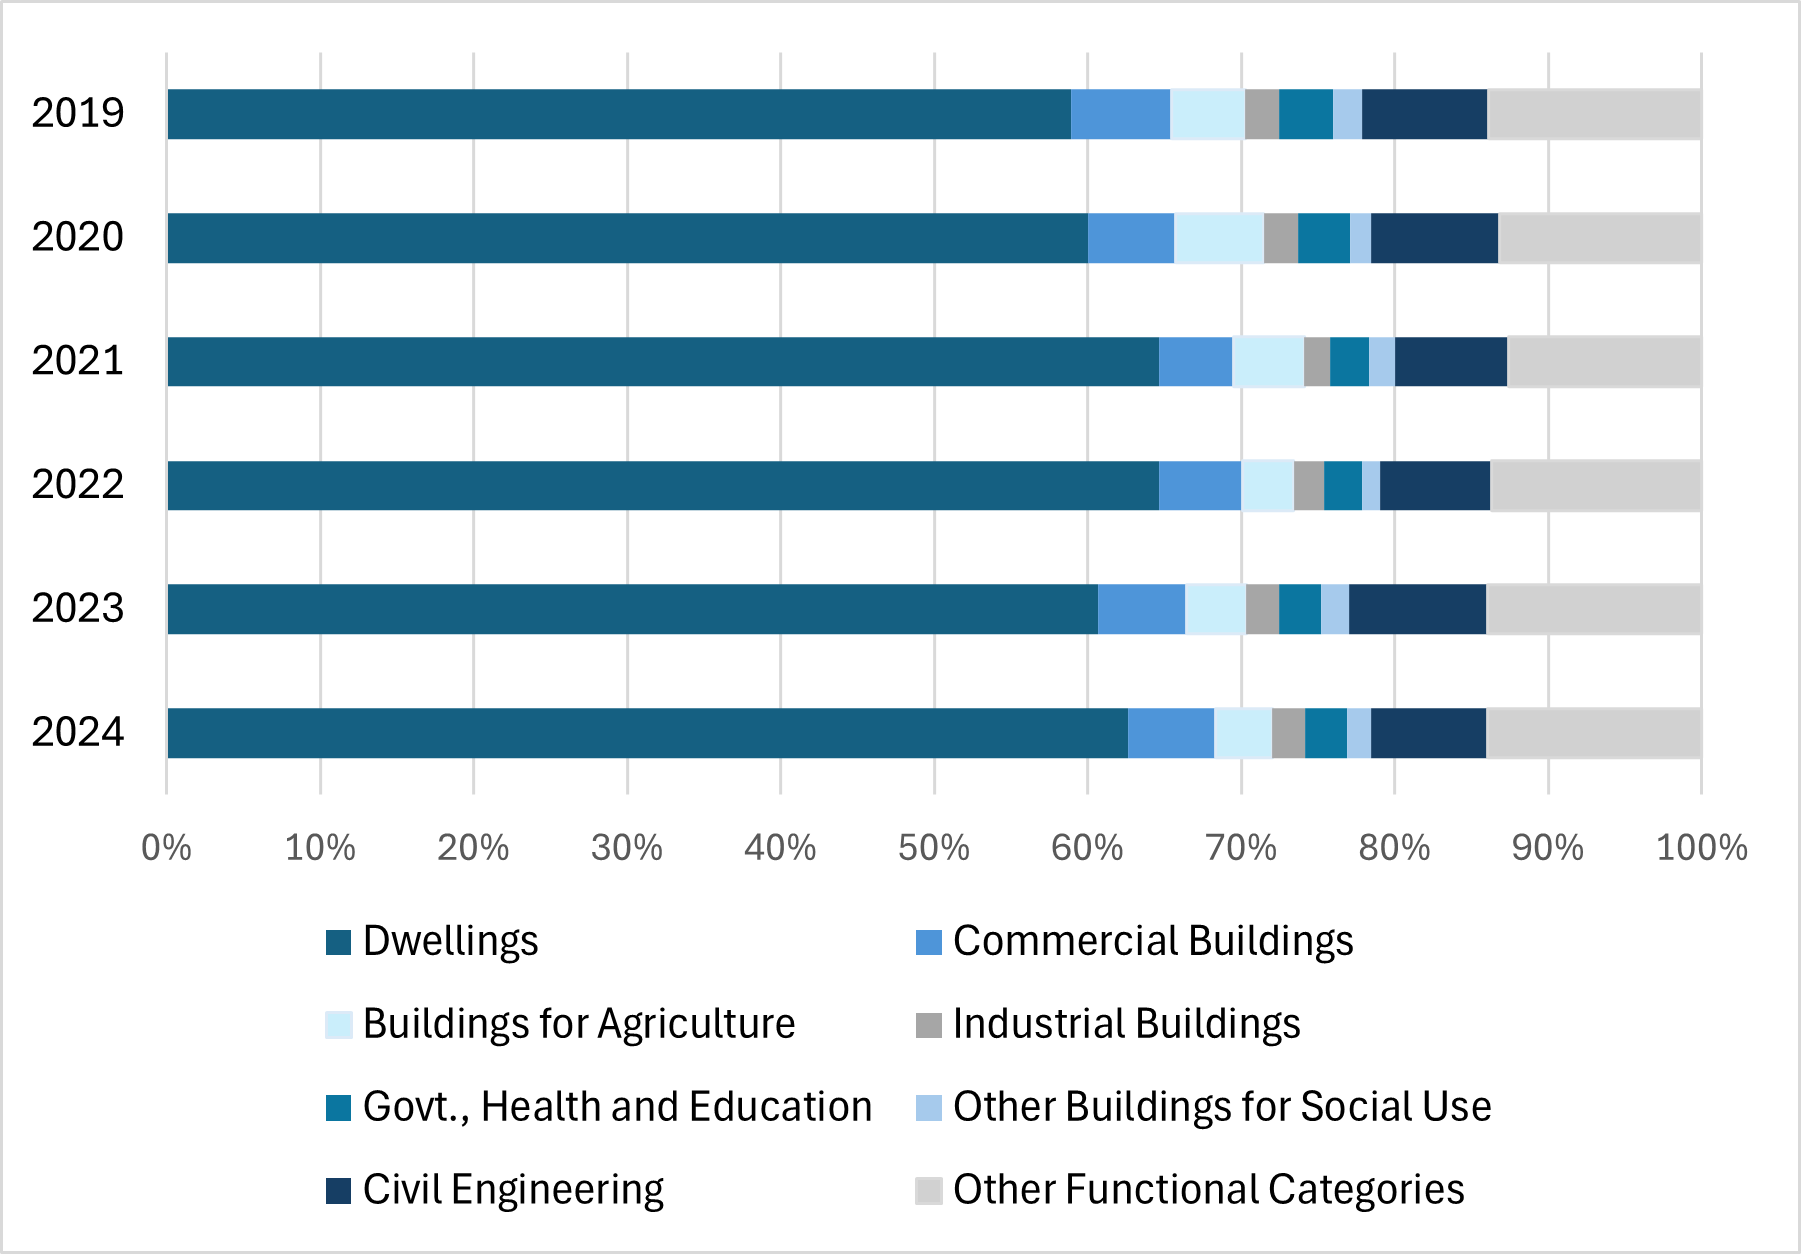
The CSO categorises planning permissions granted into eight types. Based on this categorisation, ‘dwellings’ accounted for the largest share in 2024 (63%), as in previous years. Setting aside ‘other functional categories’, ‘civil engineering’ and ‘commercial buildings’ account for the next largest shares, as in previous years.
Residential Development
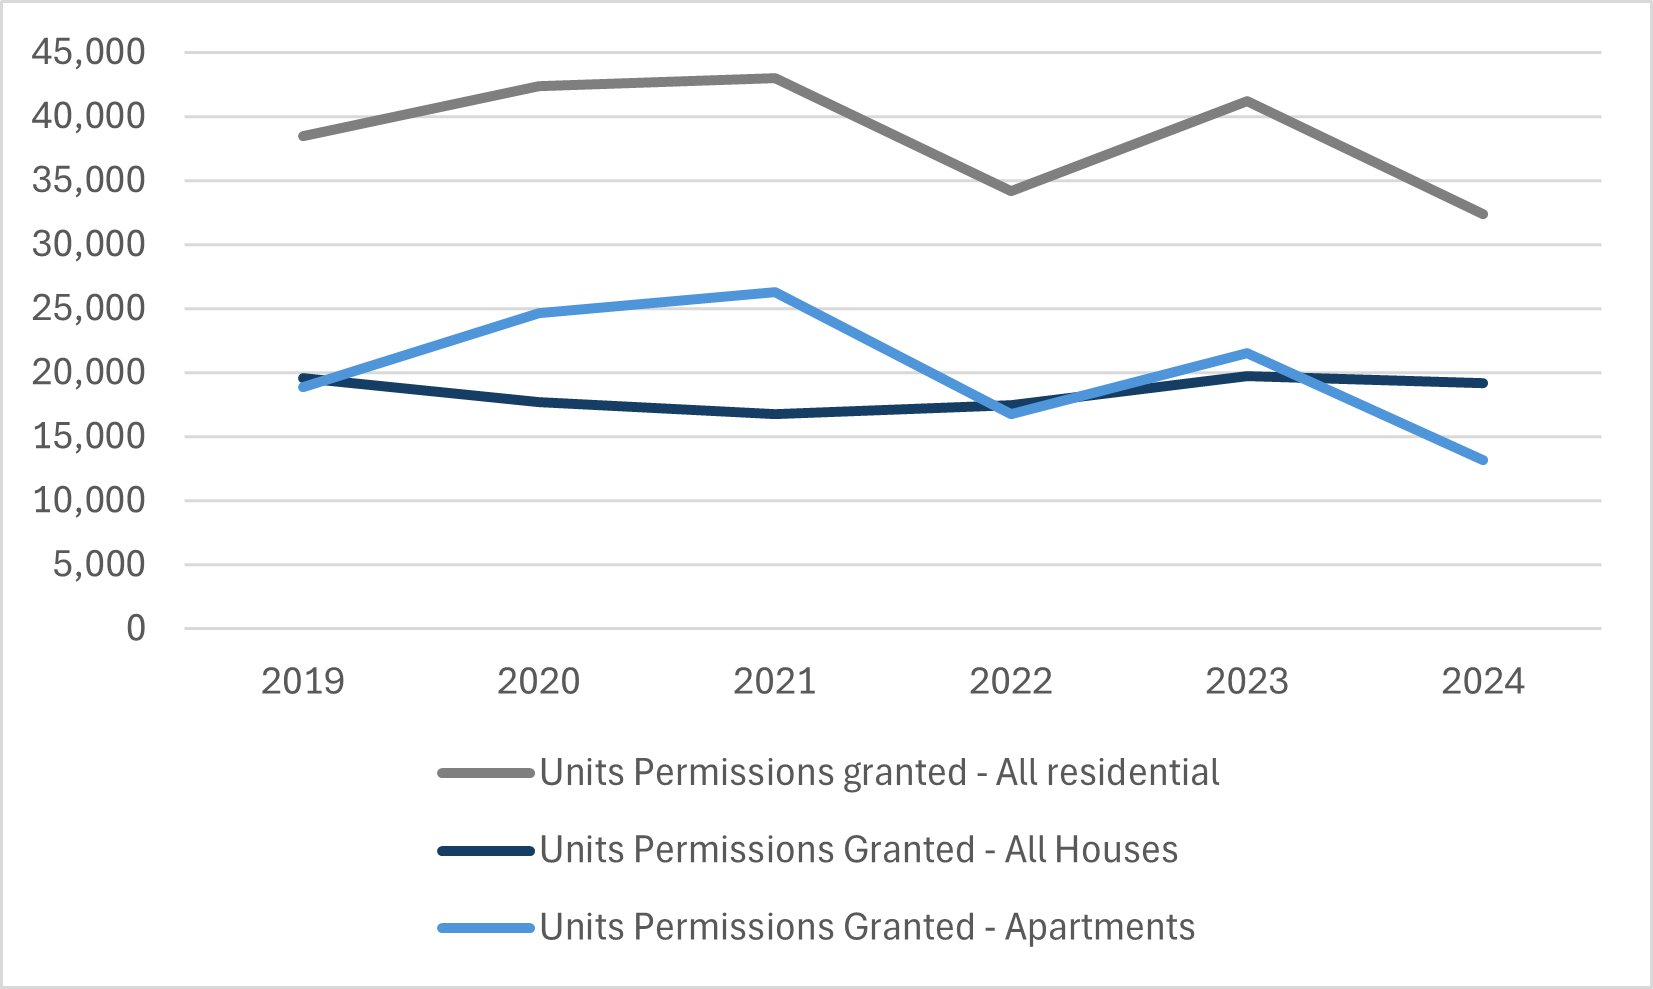
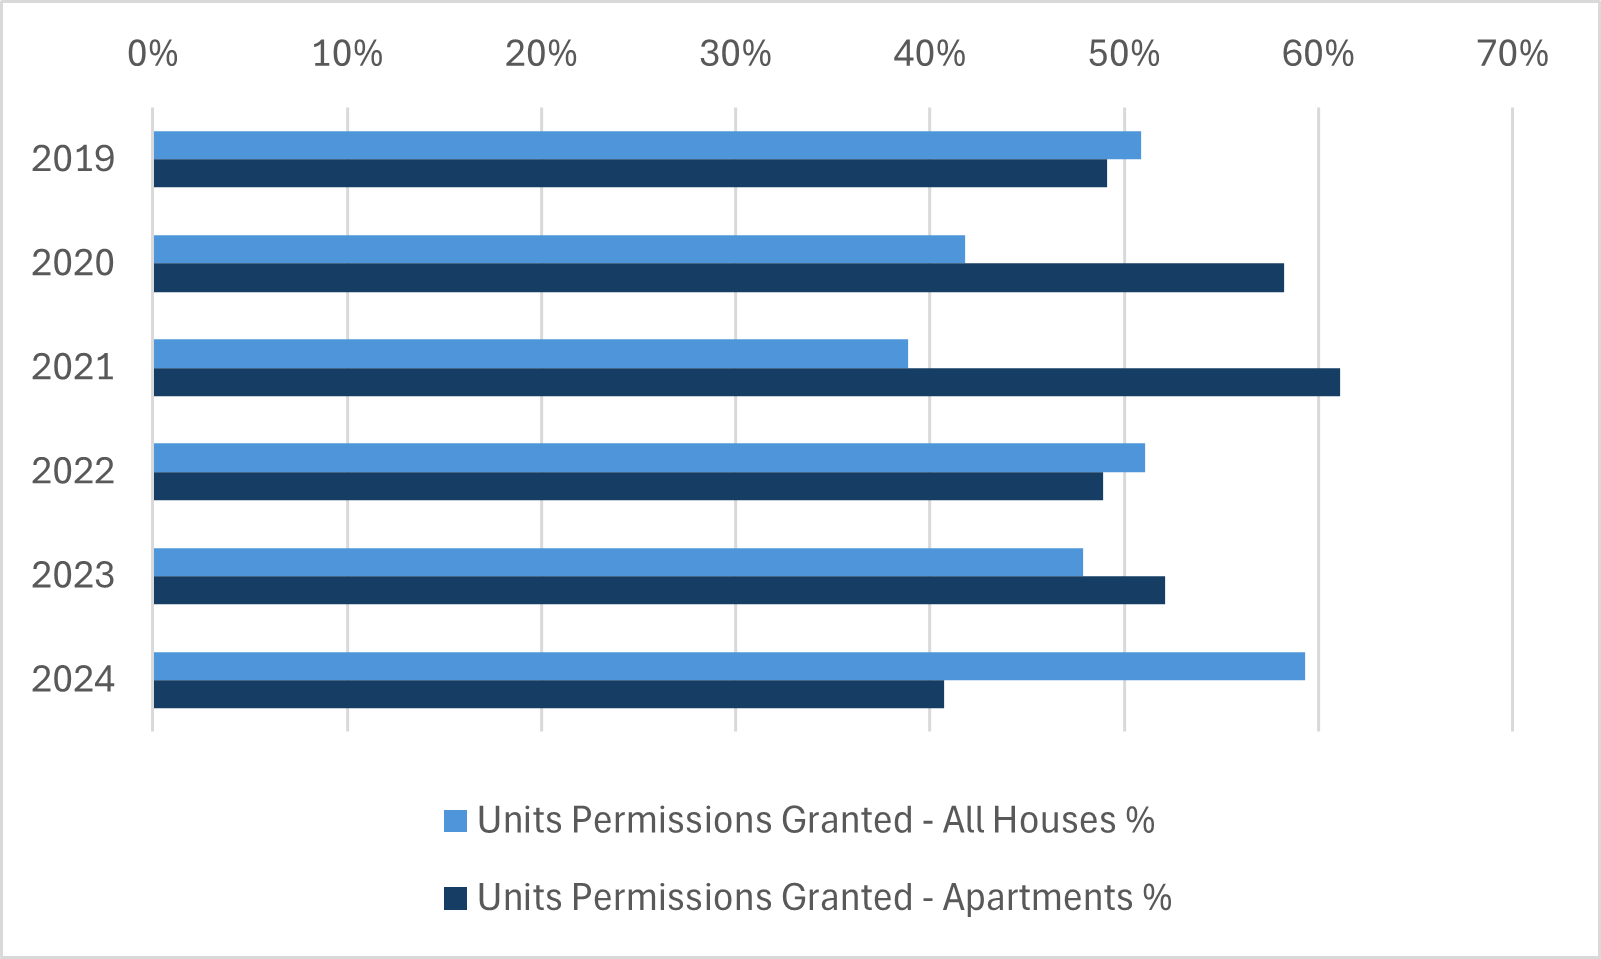
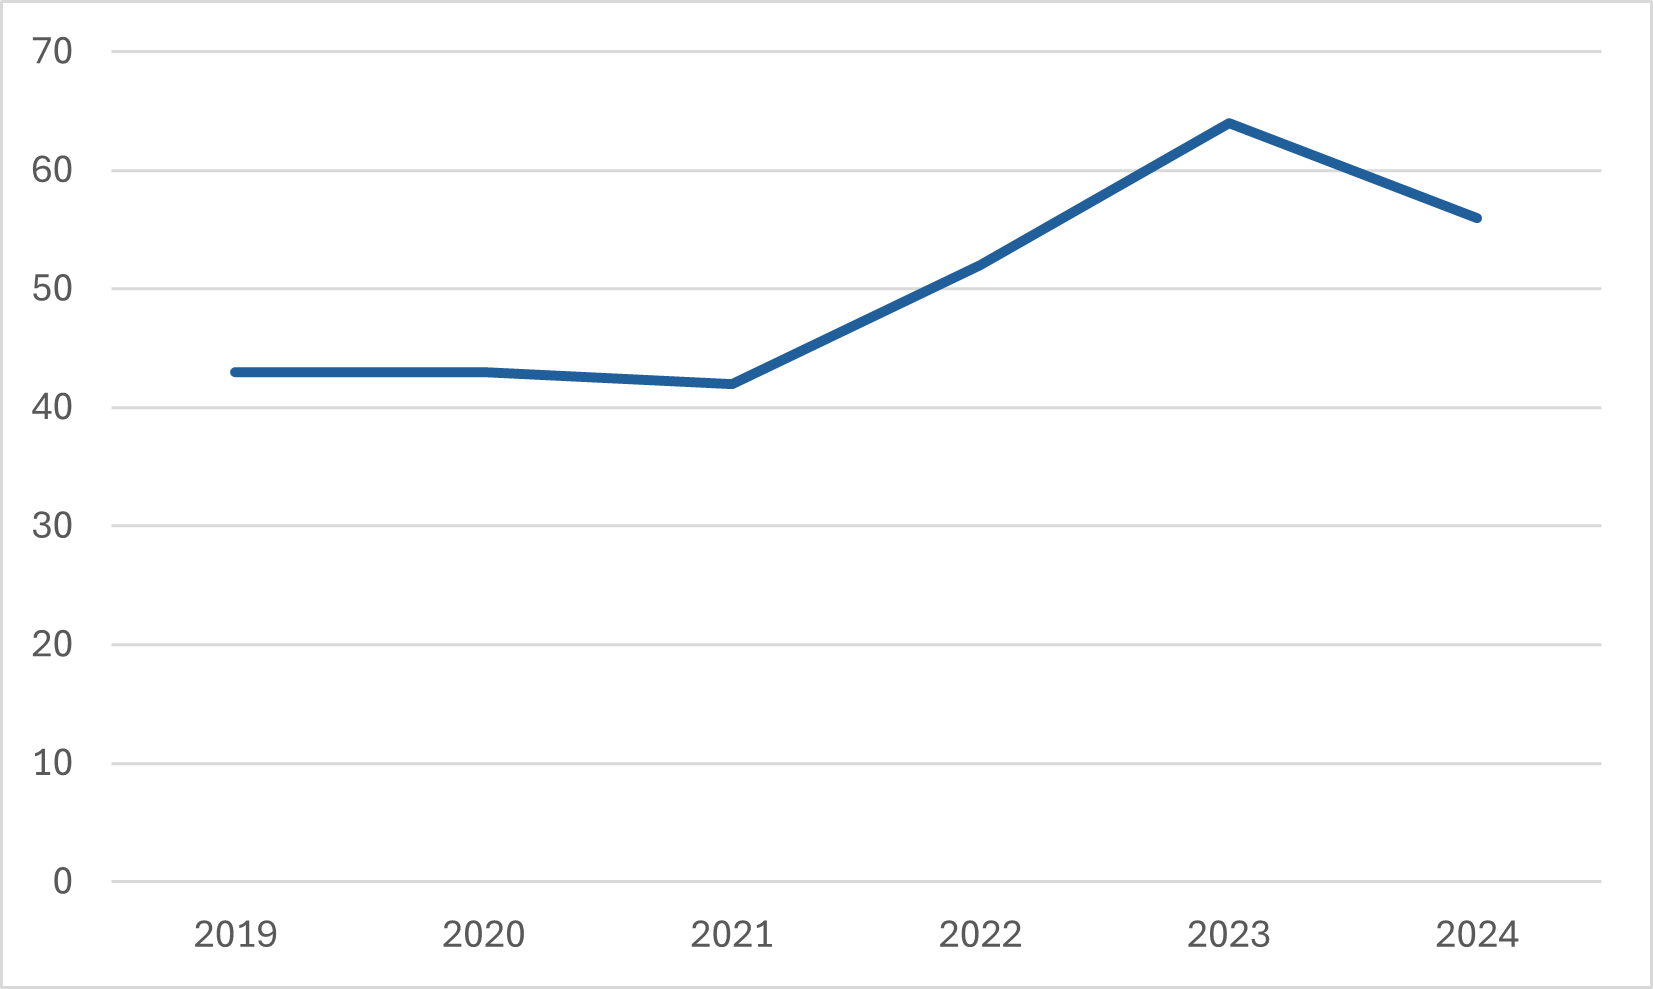
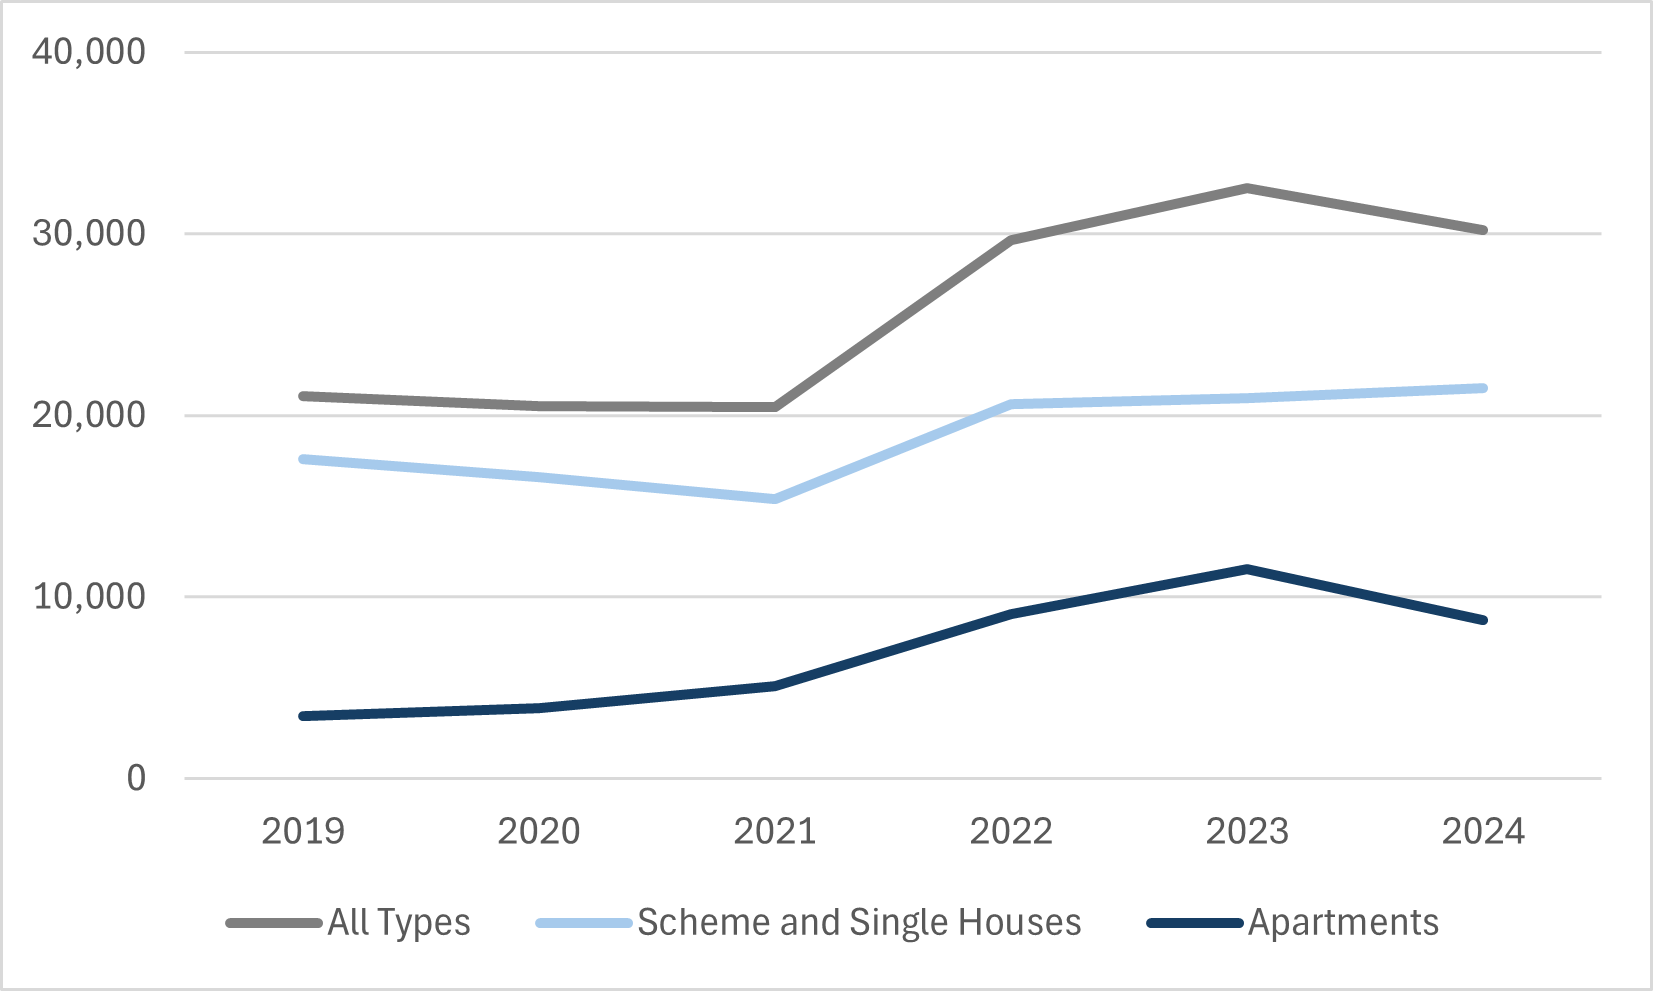
In 2024, 32,491 residential units were granted planning permission. This figure represents a decrease from 2023, when 41,225 residential units were granted planning permission. The decrease was reflected in the number of apartment permissions granted. In 2024, the number of permissions granted for houses was higher than for apartments.
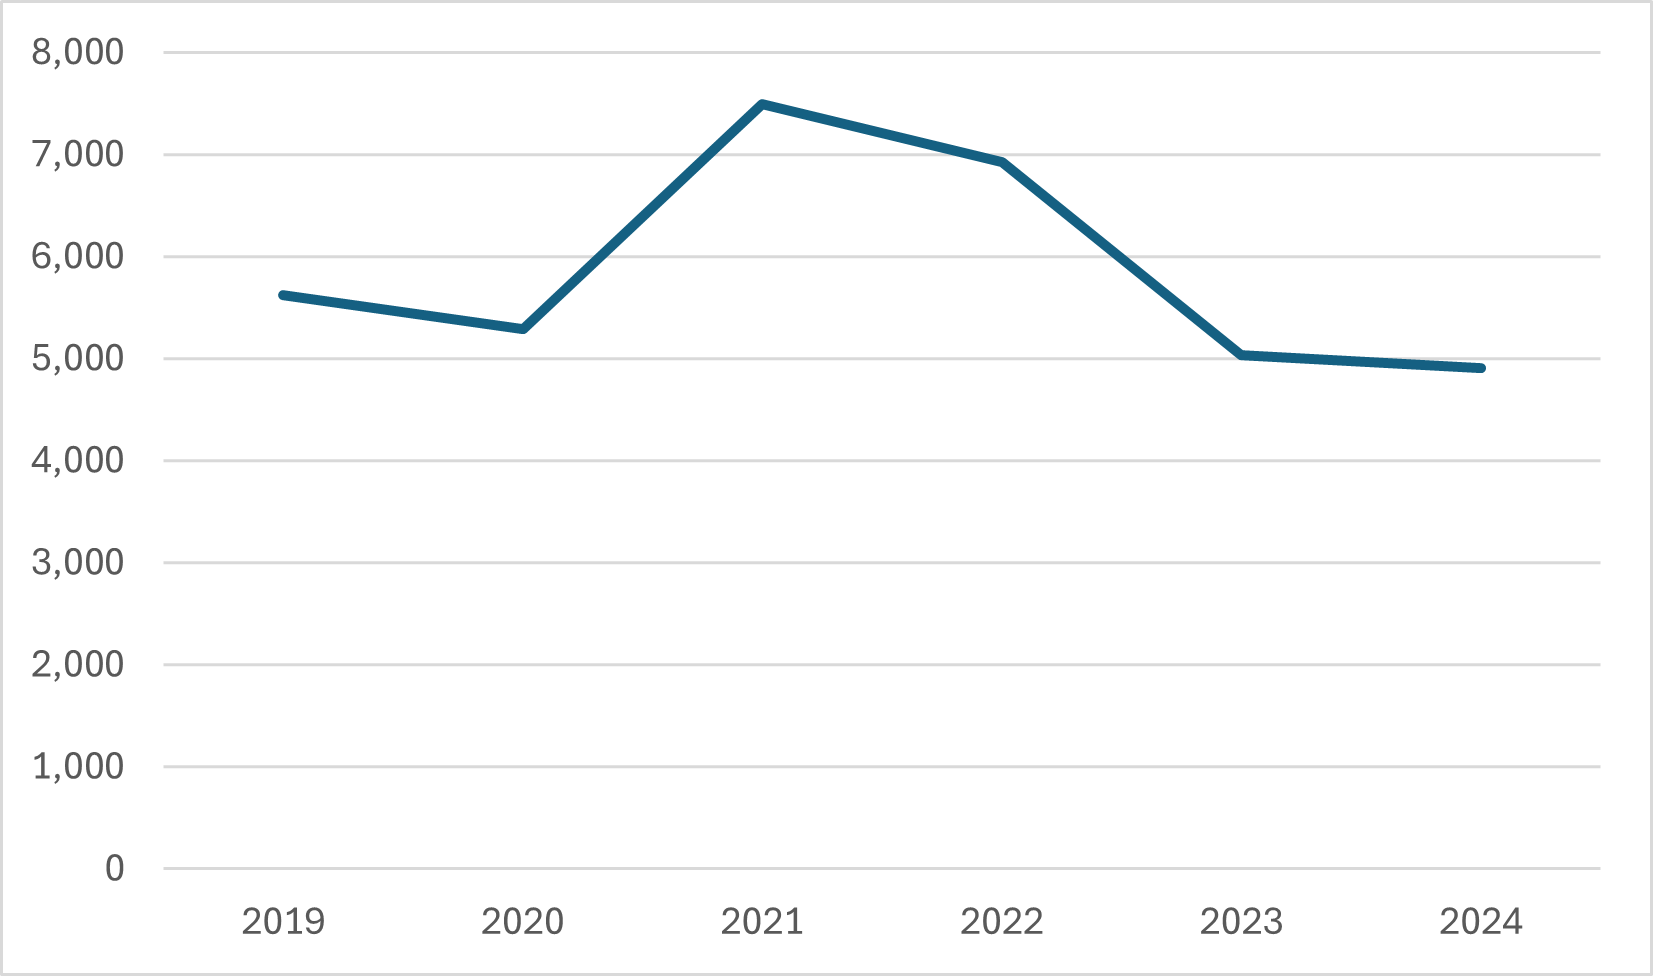
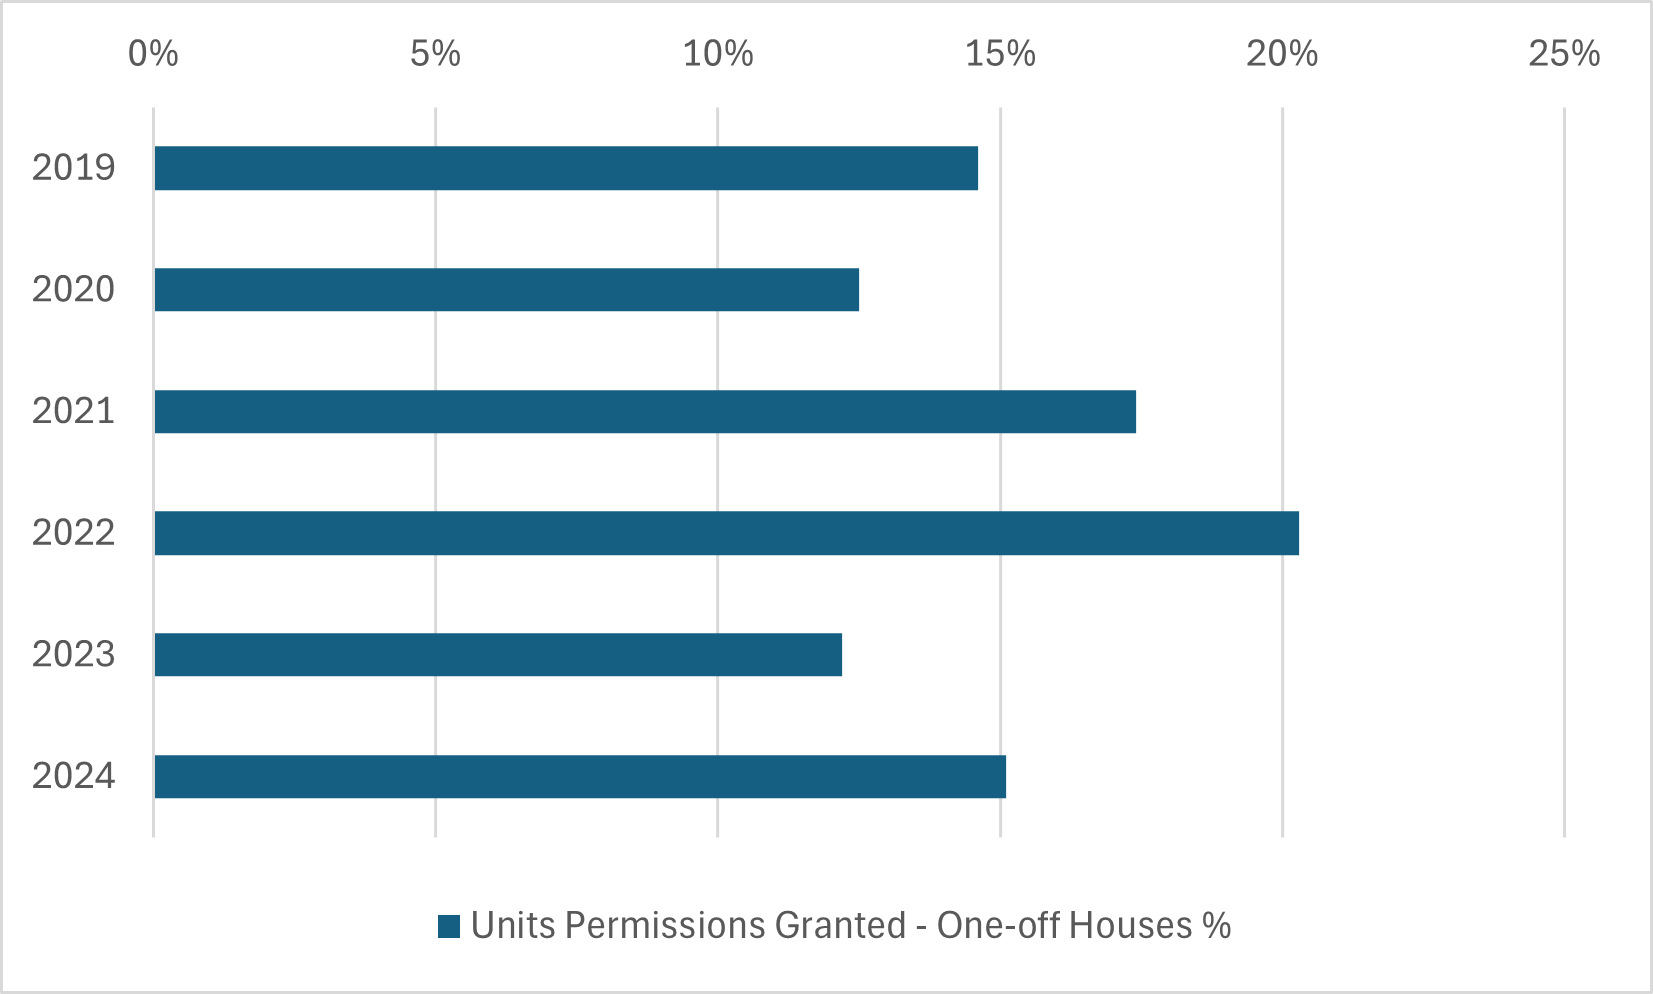
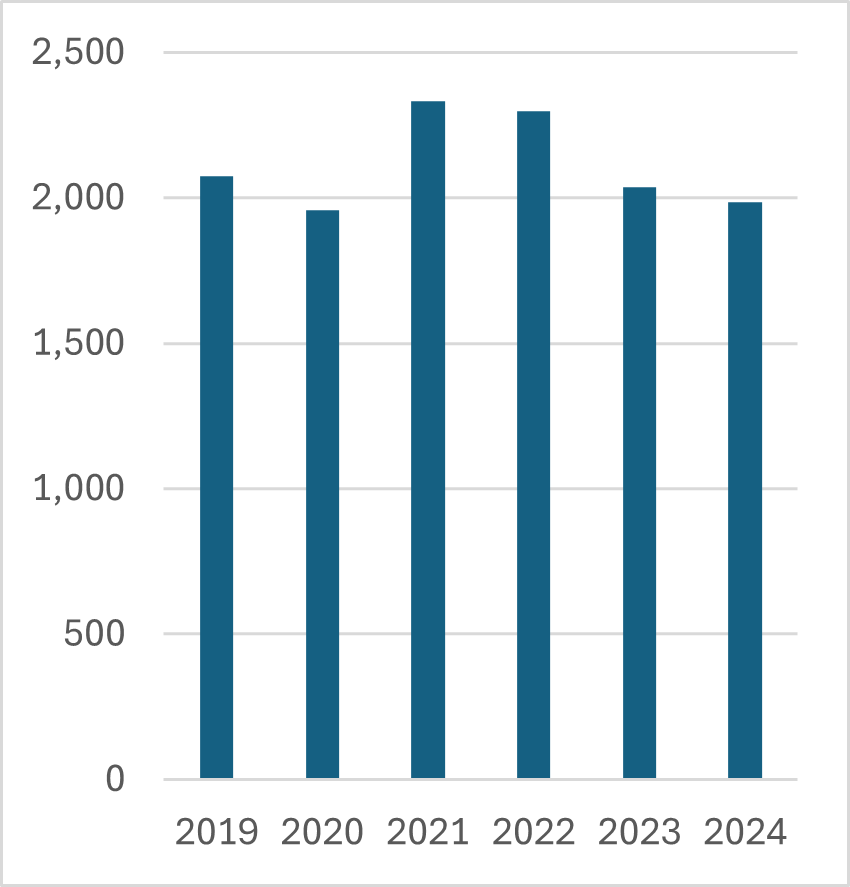
The number of permissions granted for one-off houses remained stable, with a marginal decrease from 5,032 in 2023 to 4,906 in 2024. Overall, the percentage of one-off house permissions in 2024 (15.1%) was higher than in 2023 (12.2%).
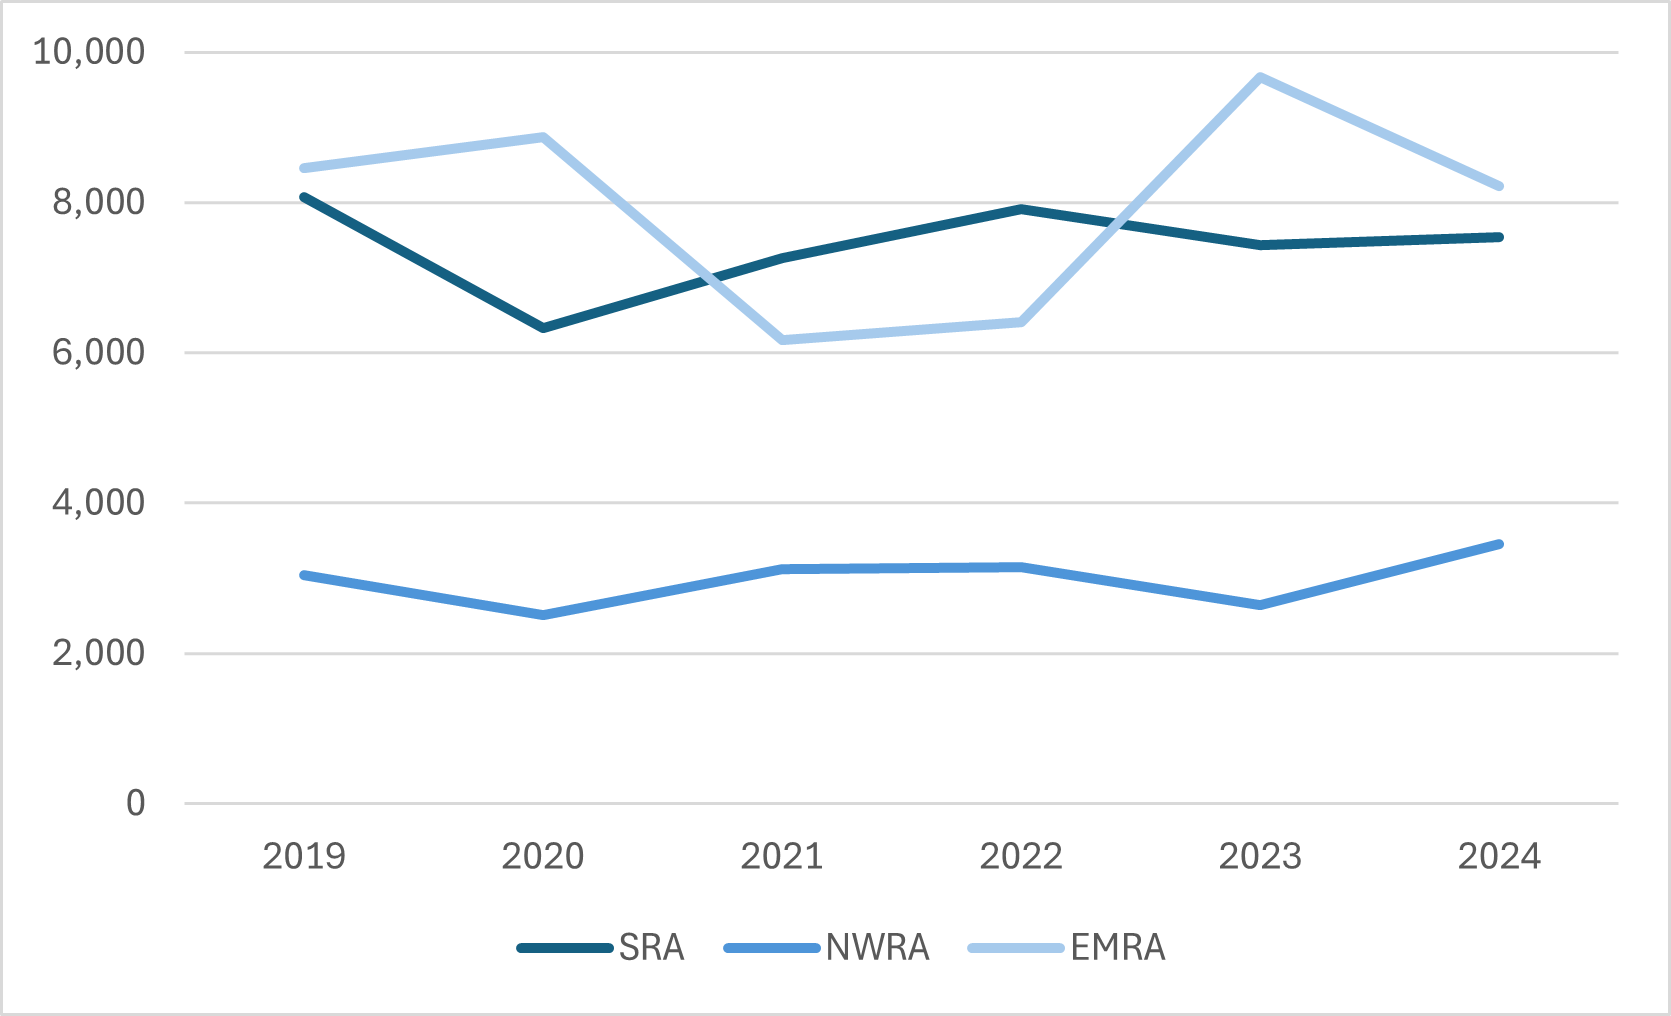
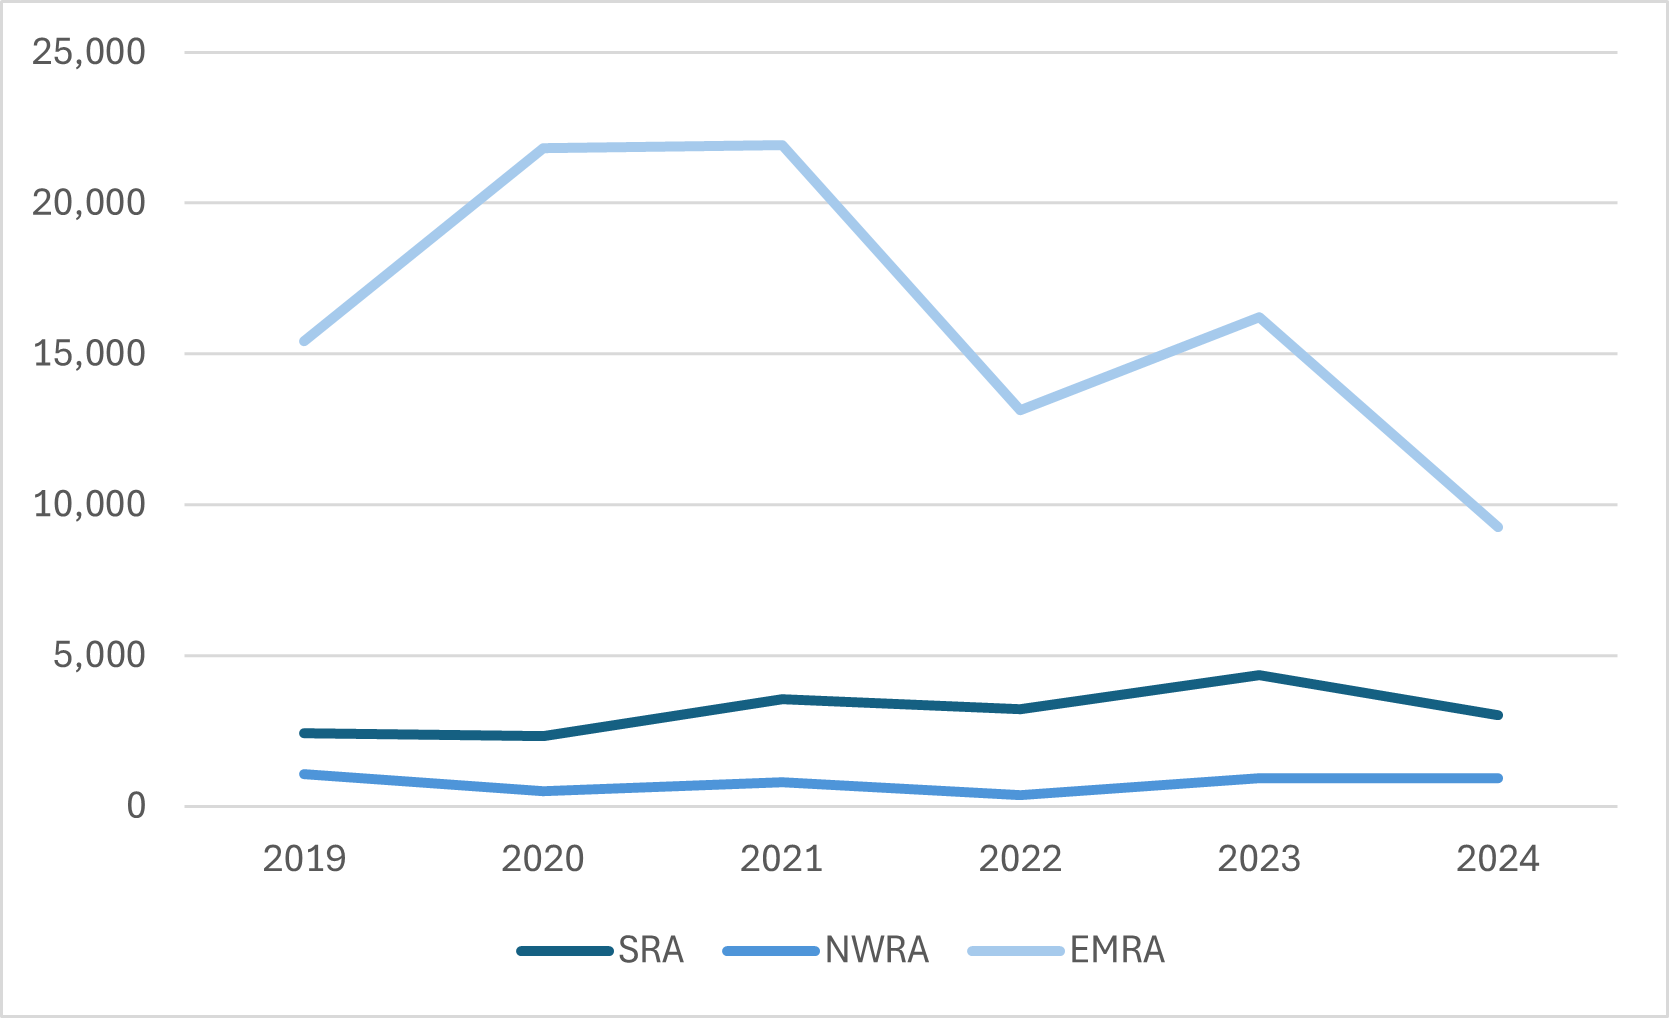
In terms of the distribution of permitted residential units across the regional assembly areas, EMRA has the highest number (17,471; 54%), followed by SRA (10,539; 32%) and NWRA (4,391; 14%).
In 2024, the total number of residential units granted planning permission increased in NWRA. The number of houses permitted increased in NWRA and SRA and decreased in EMRA. The number of permitted apartments increased slightly in NWRA and decreased in both EMRA and SRA.
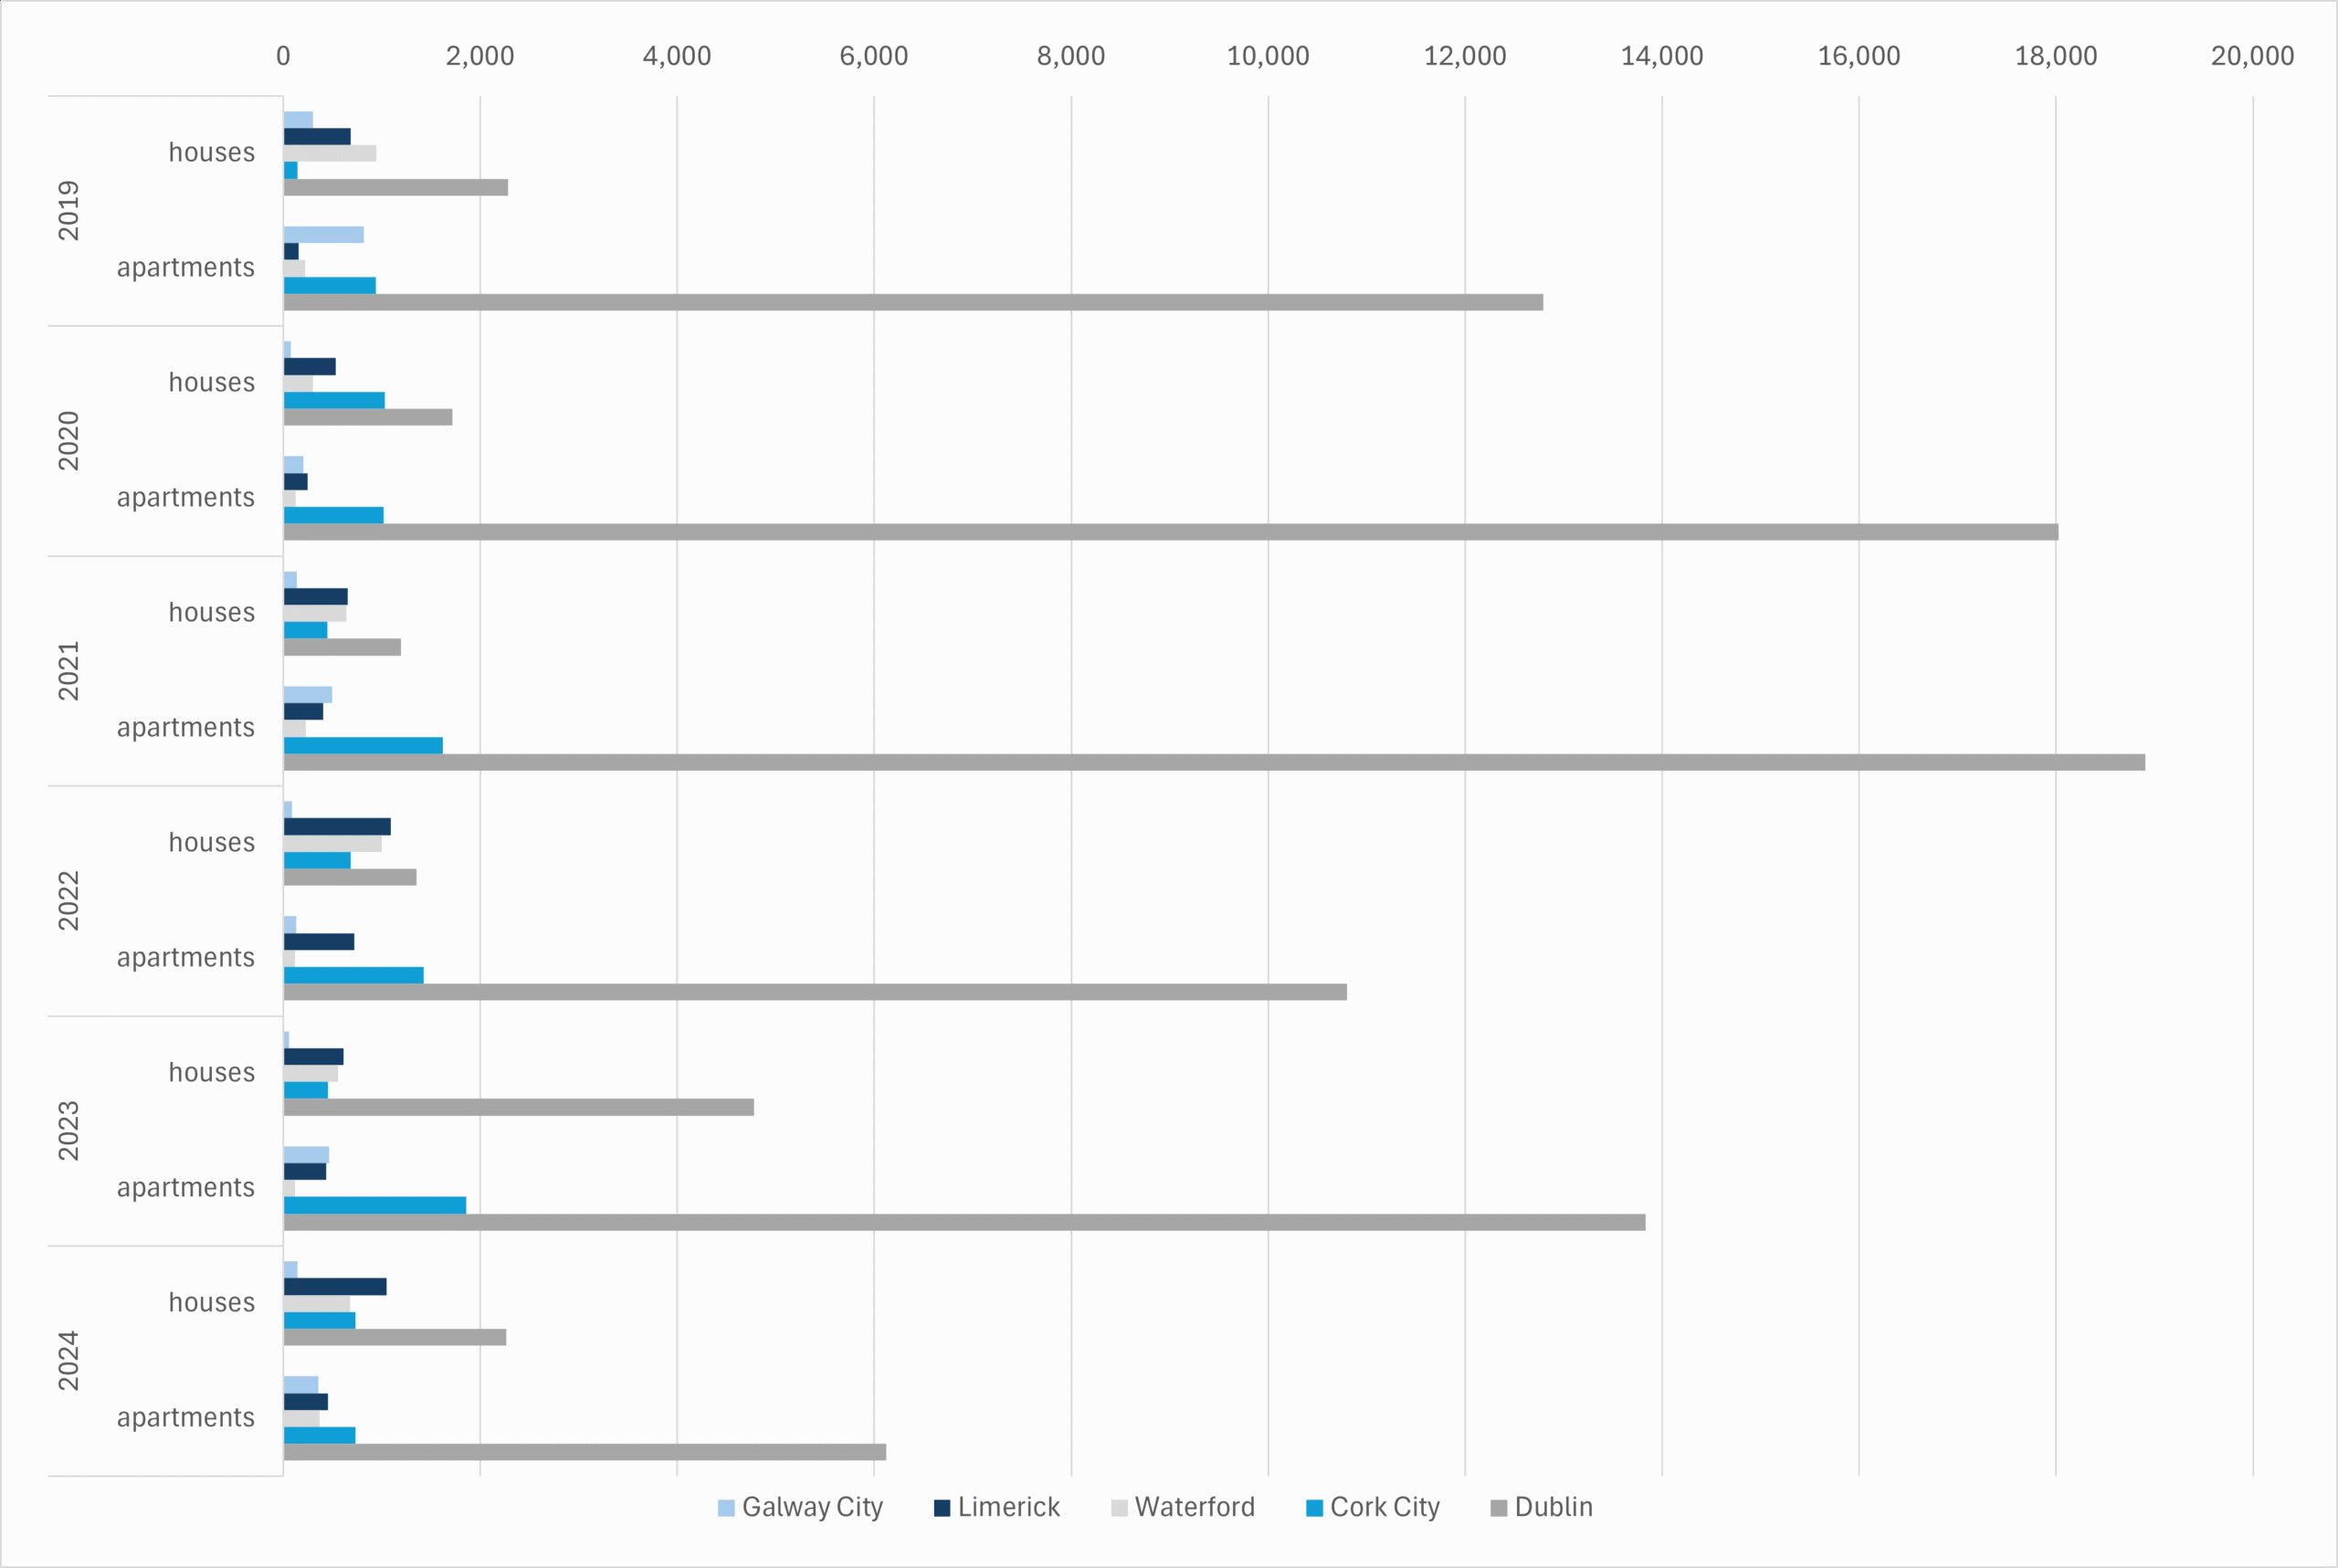
In terms of apartments, compared to 2023, Waterford and Limerick experienced an increase in the number of permissions granted. In addition to apartments, the number of houses granted permission decreased in Dublin in 2024, whereas in the other cities it increased. Dublin (which comprises four local authorities) was the only city to experience a decrease in both the number of houses and apartments granted permission in 2024.
In 2024, the total number of completed residential units decreased to 30,206. Compared with 2023, 532 more houses and 2,828 fewer apartments were completed.
Non-residential Development
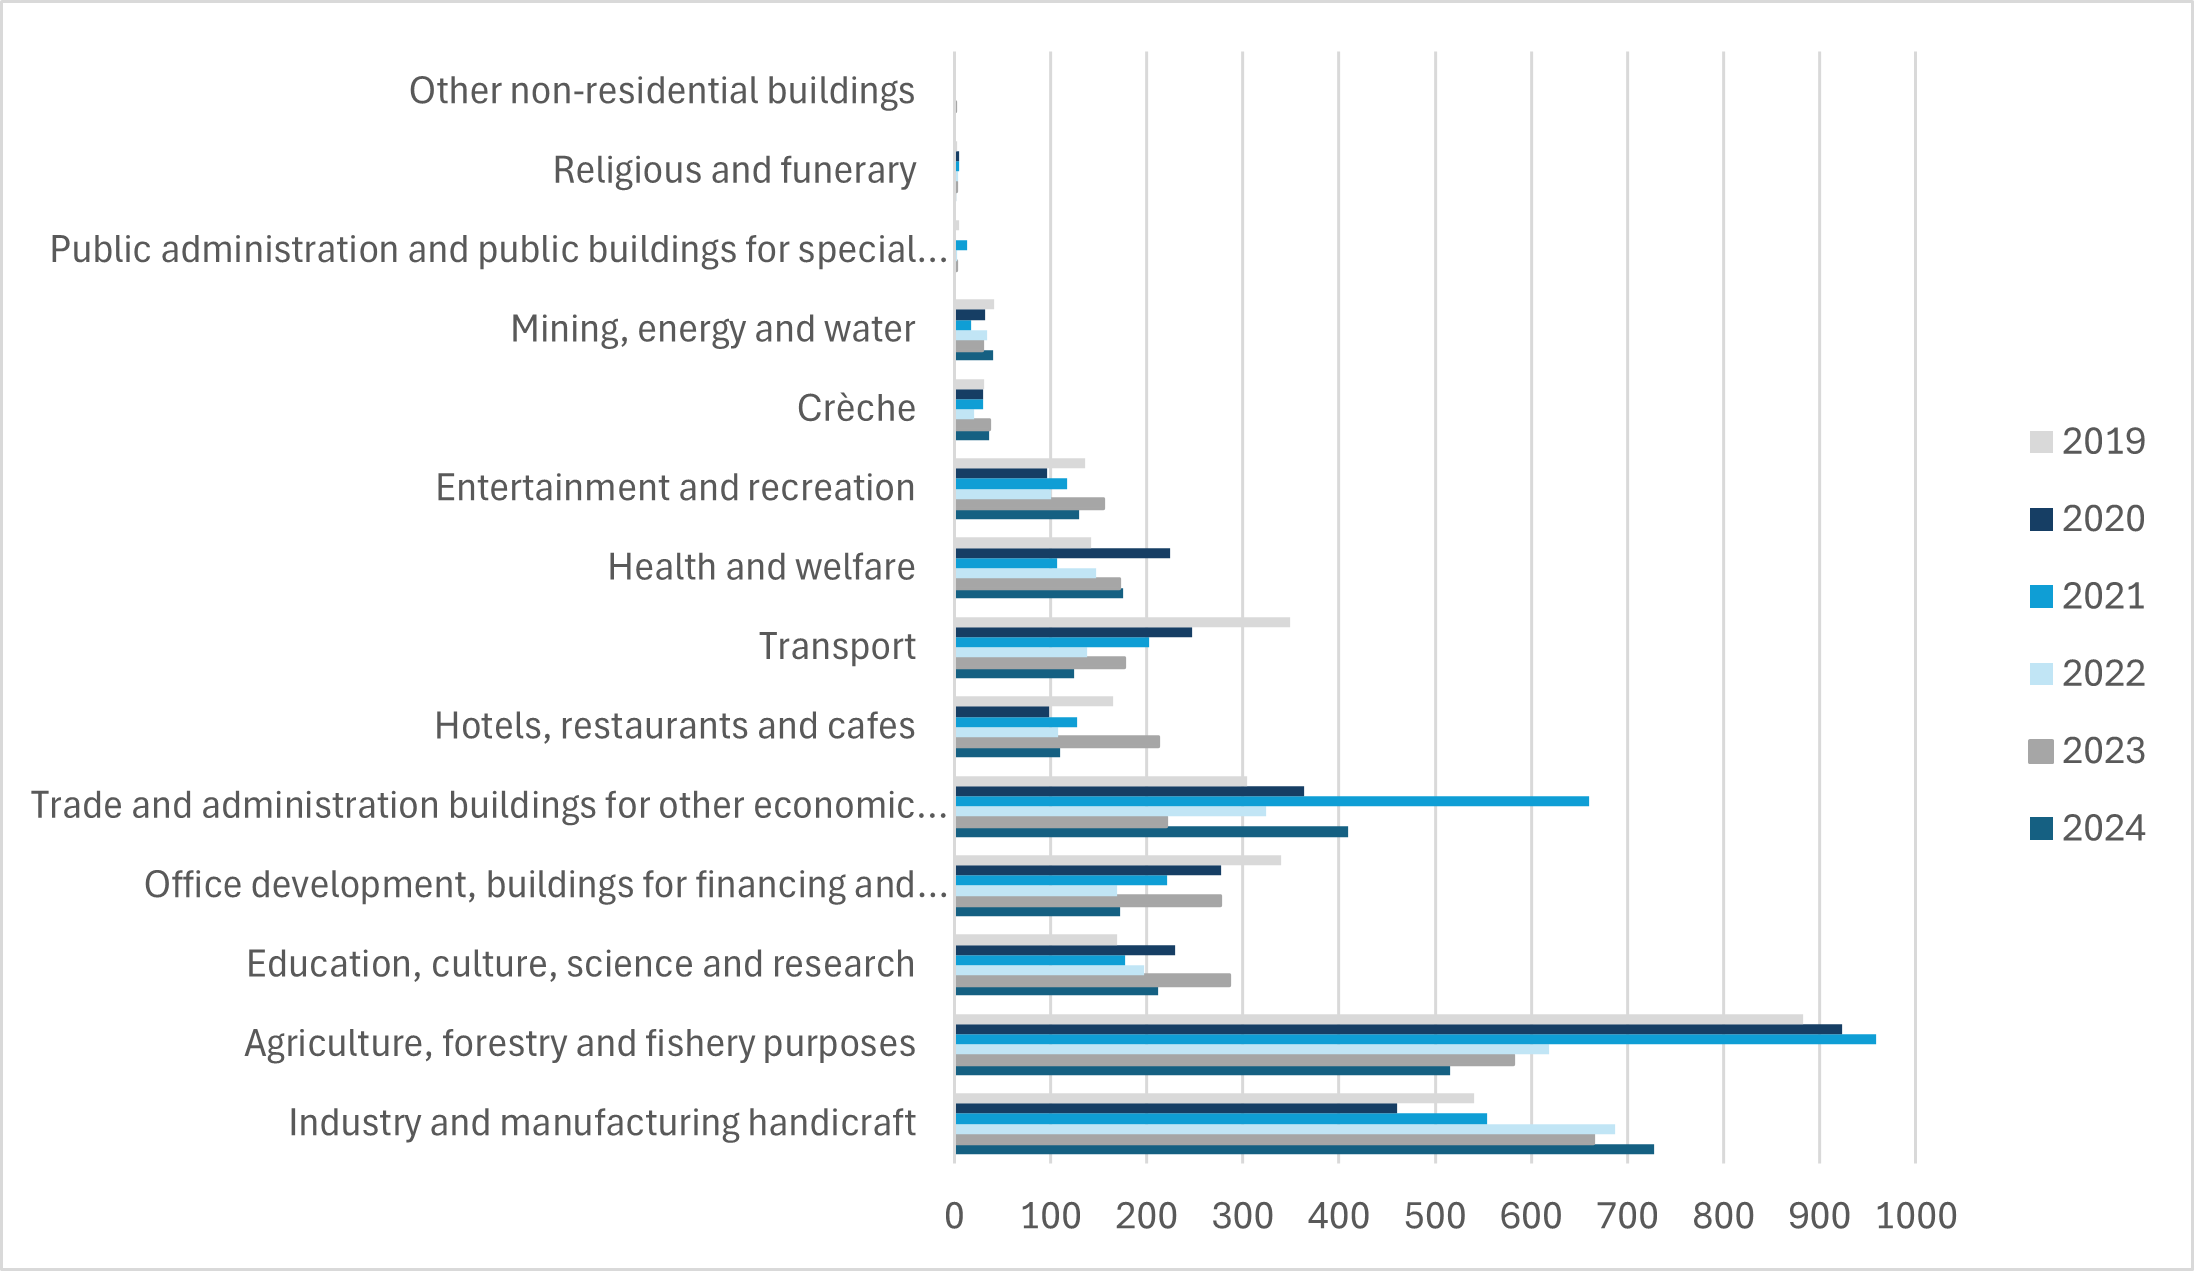
In 2024, in terms of non-residential permitted floor space, some increases were observed in the categories:
- industry and manufacturing
- handicraft
- trade and administration buildings for other economic activities
- health and welfare
- mining, energy and water
Planning Appeals
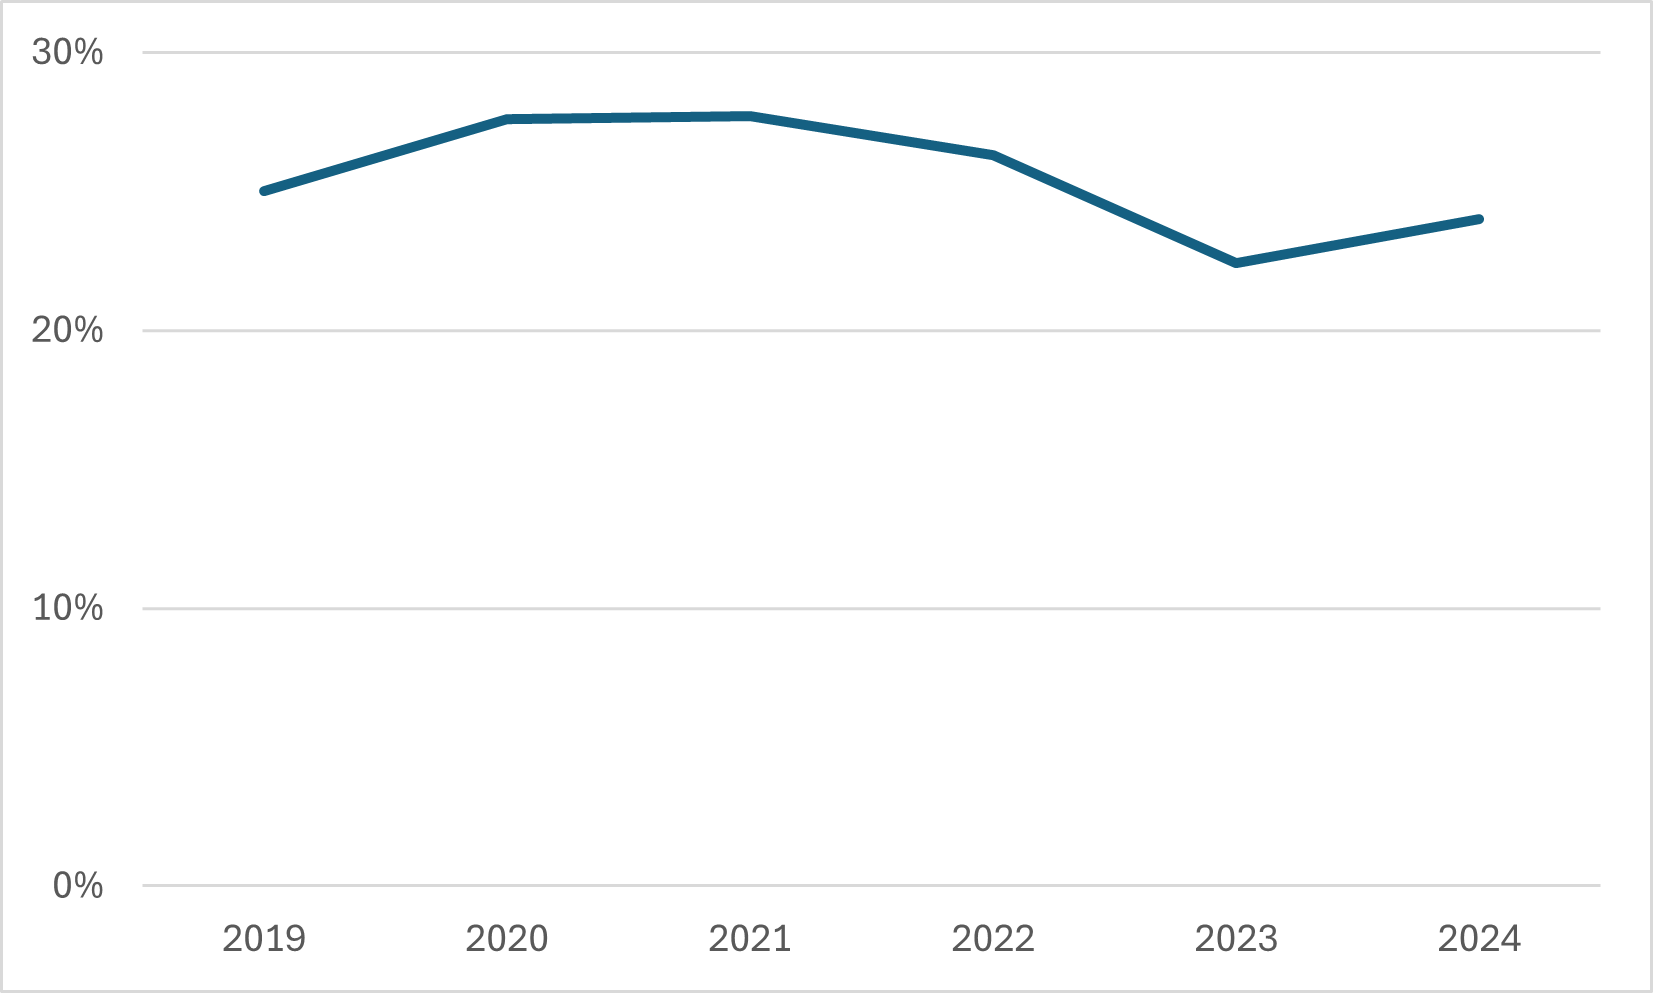
The number of appeals to ACP continued to decrease in 2024. The rate of the local authority decisions appealed to ACP also decreased from 7.4% (2023) to 5.9% (2024).
The reversal rate on appeals increased in 2024 (24%), following a decline since 2021.
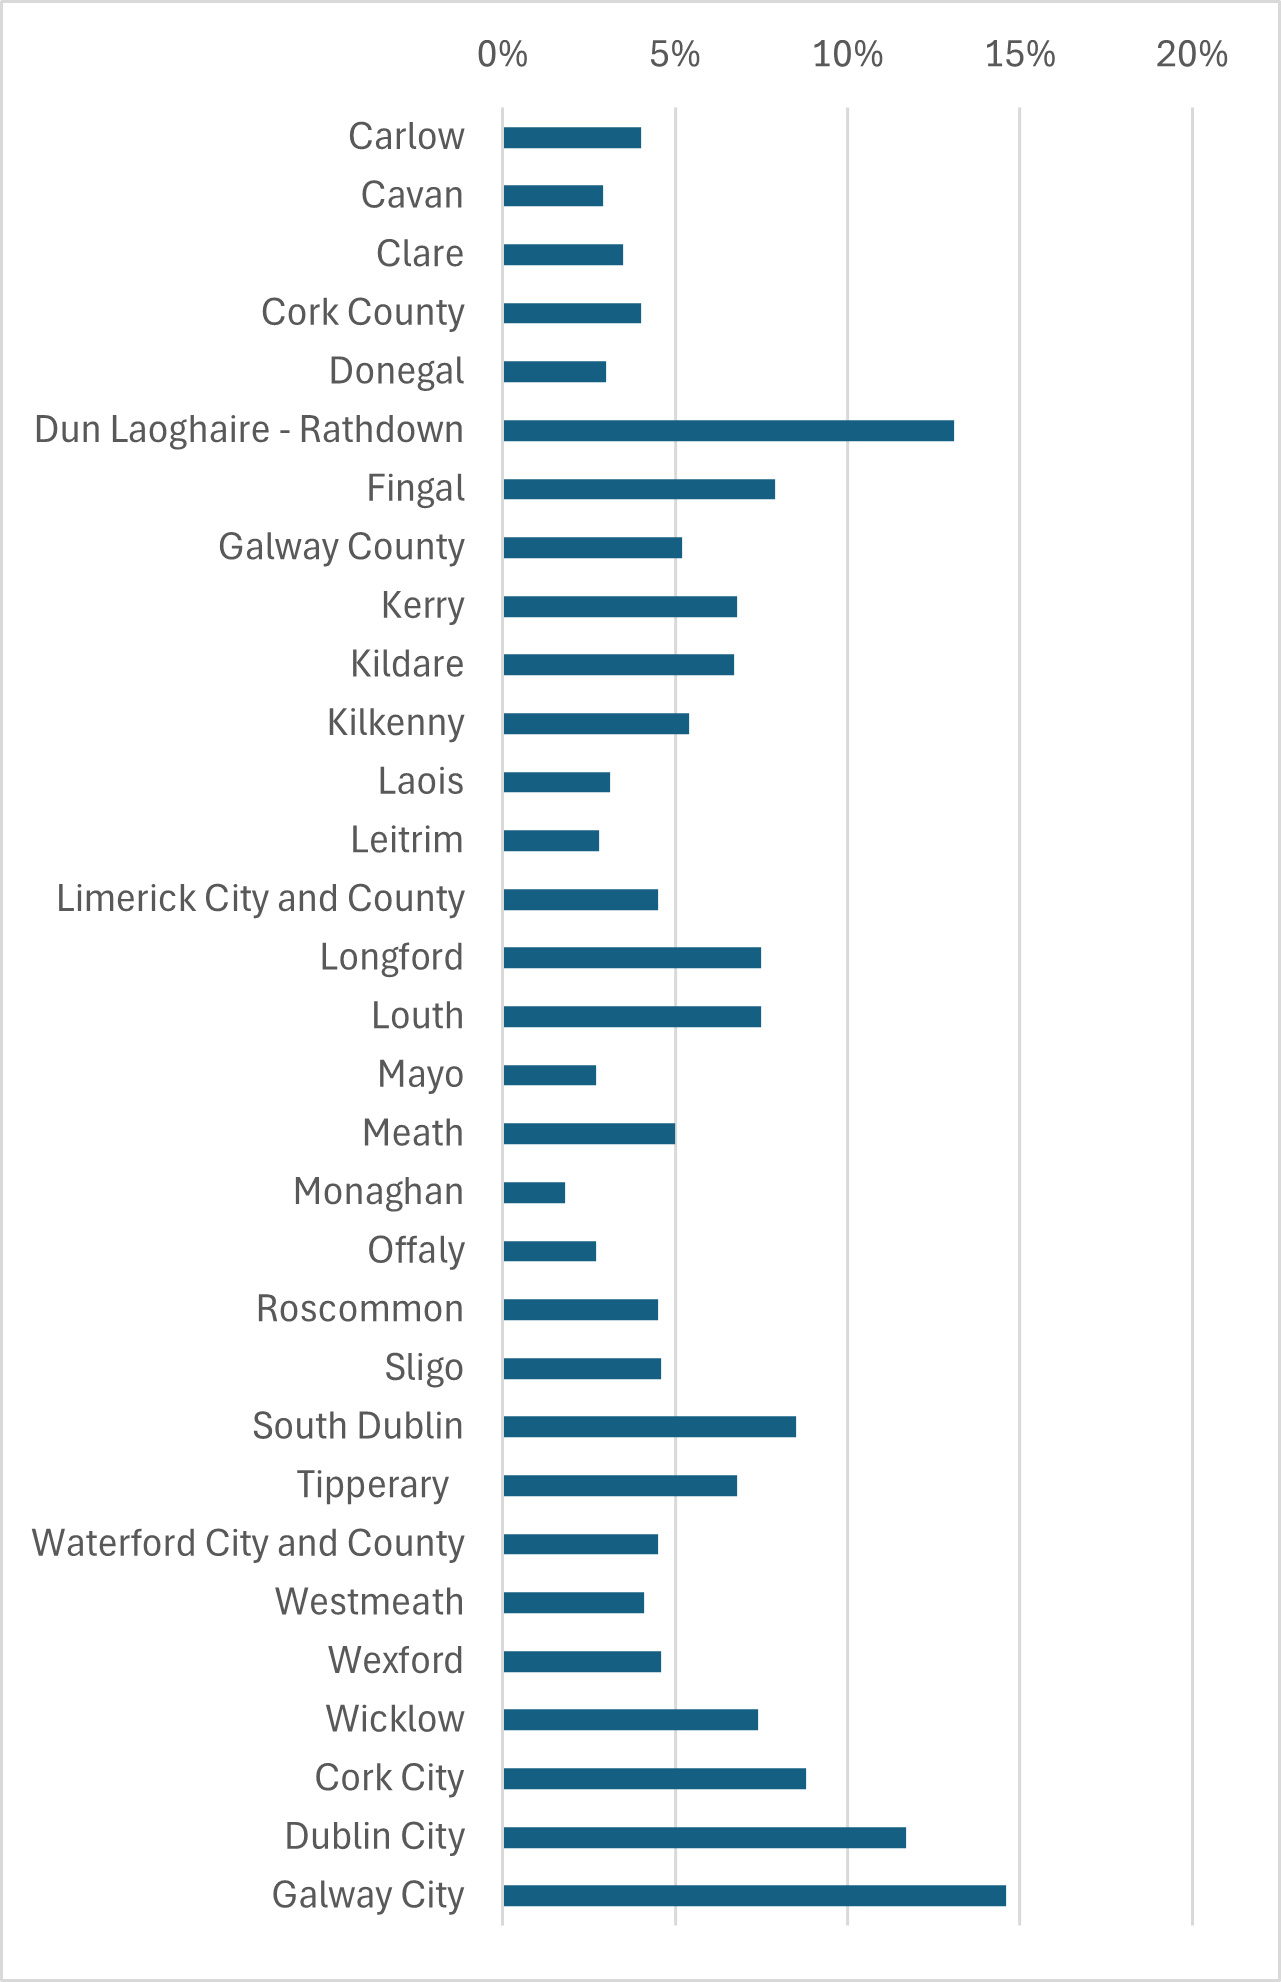
Among local authorities, appeal rates range from 1.8% to 14.6%, with the lowest in Monaghan and the highest in Galway City.
Planning Enforcement
The NOAC Local Authority Performance Indicator Report identifies the number of planning enforcement cases – either referred by the public or local authorities themselves – that are investigated by local authorities.
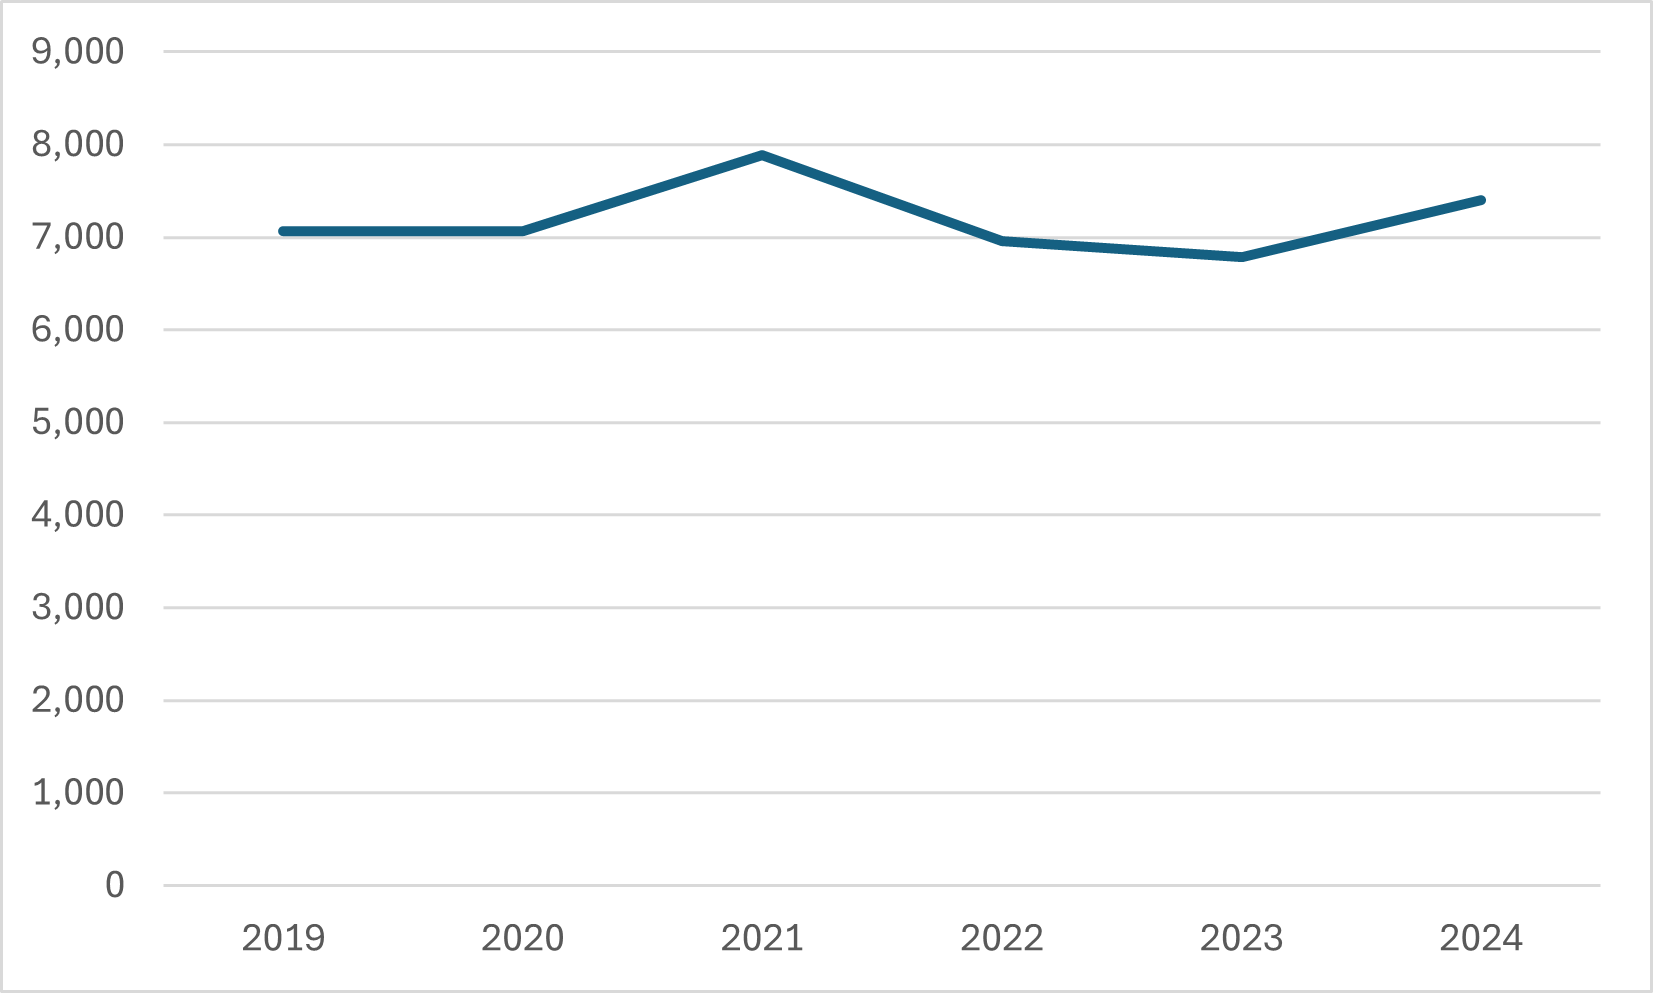
In 2024, local authorities investigated 7,396 new enforcement cases, up from 6,783 the previous year. The number of planning enforcement investigations which closed in 2024 was 6,349. This was 104 fewer investigations closed than in 2023.
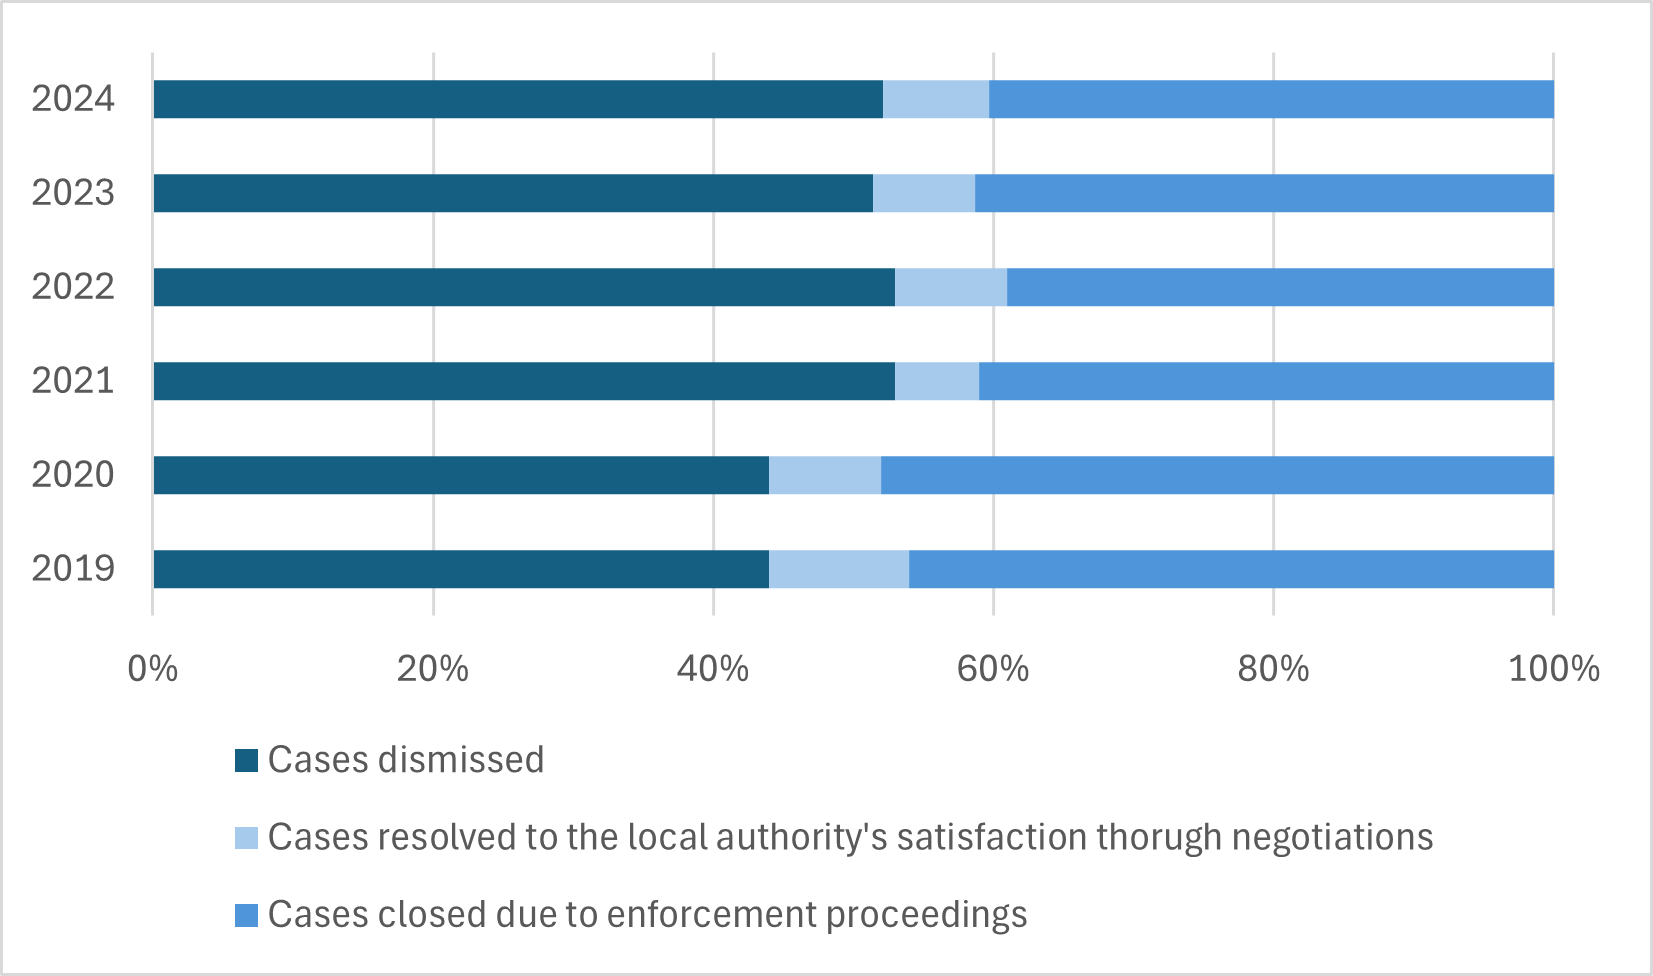
Cases are closed for various reasons, such as cases dismissed, cases resolved to the local authority’s satisfaction through negotiations, and cases closed due to enforcement proceedings. As in the previous three years, the main reason in 2024 for cases being closed was that they were being dismissed.
Land Activation and Vacancy
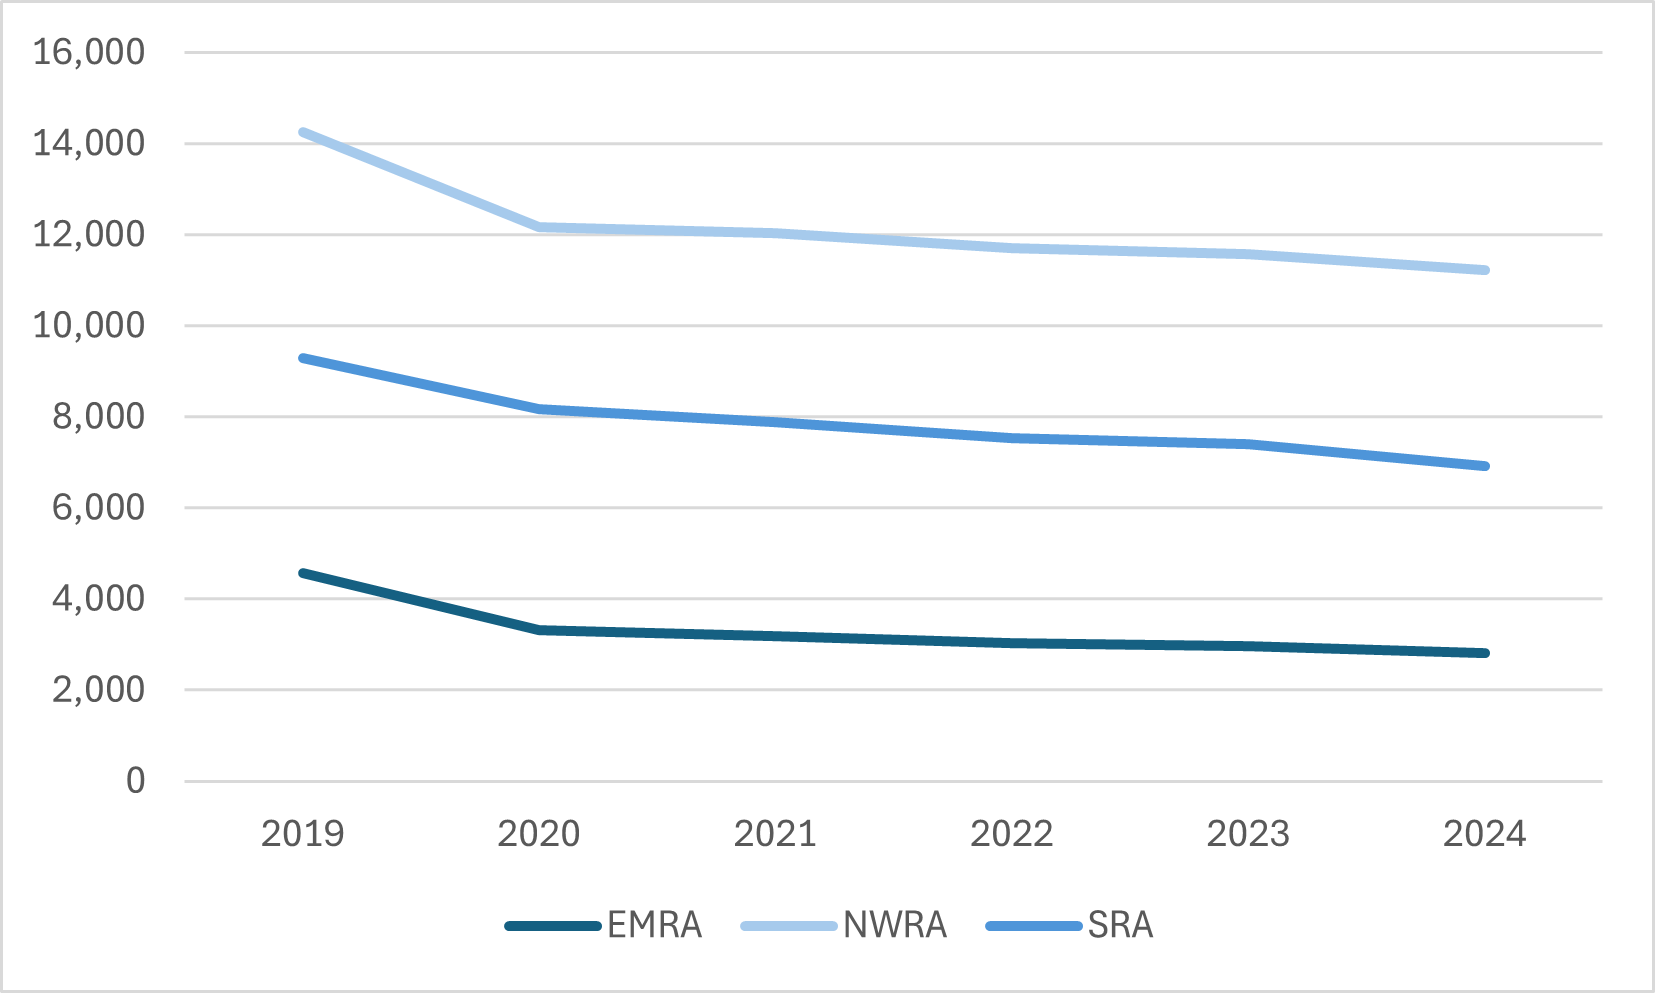
In 2024, there was a small decrease nationally in the number of derelict residential properties from 21,947 to 20,953. Derelict residential properties are mainly in the NWRA (11,232).
In 2024, 4,729 Vacant Property Refurbishment Grant applications were received, fewer than in the previous year. In 2024, 4,366 applications were approved, which was much higher than in 2023.
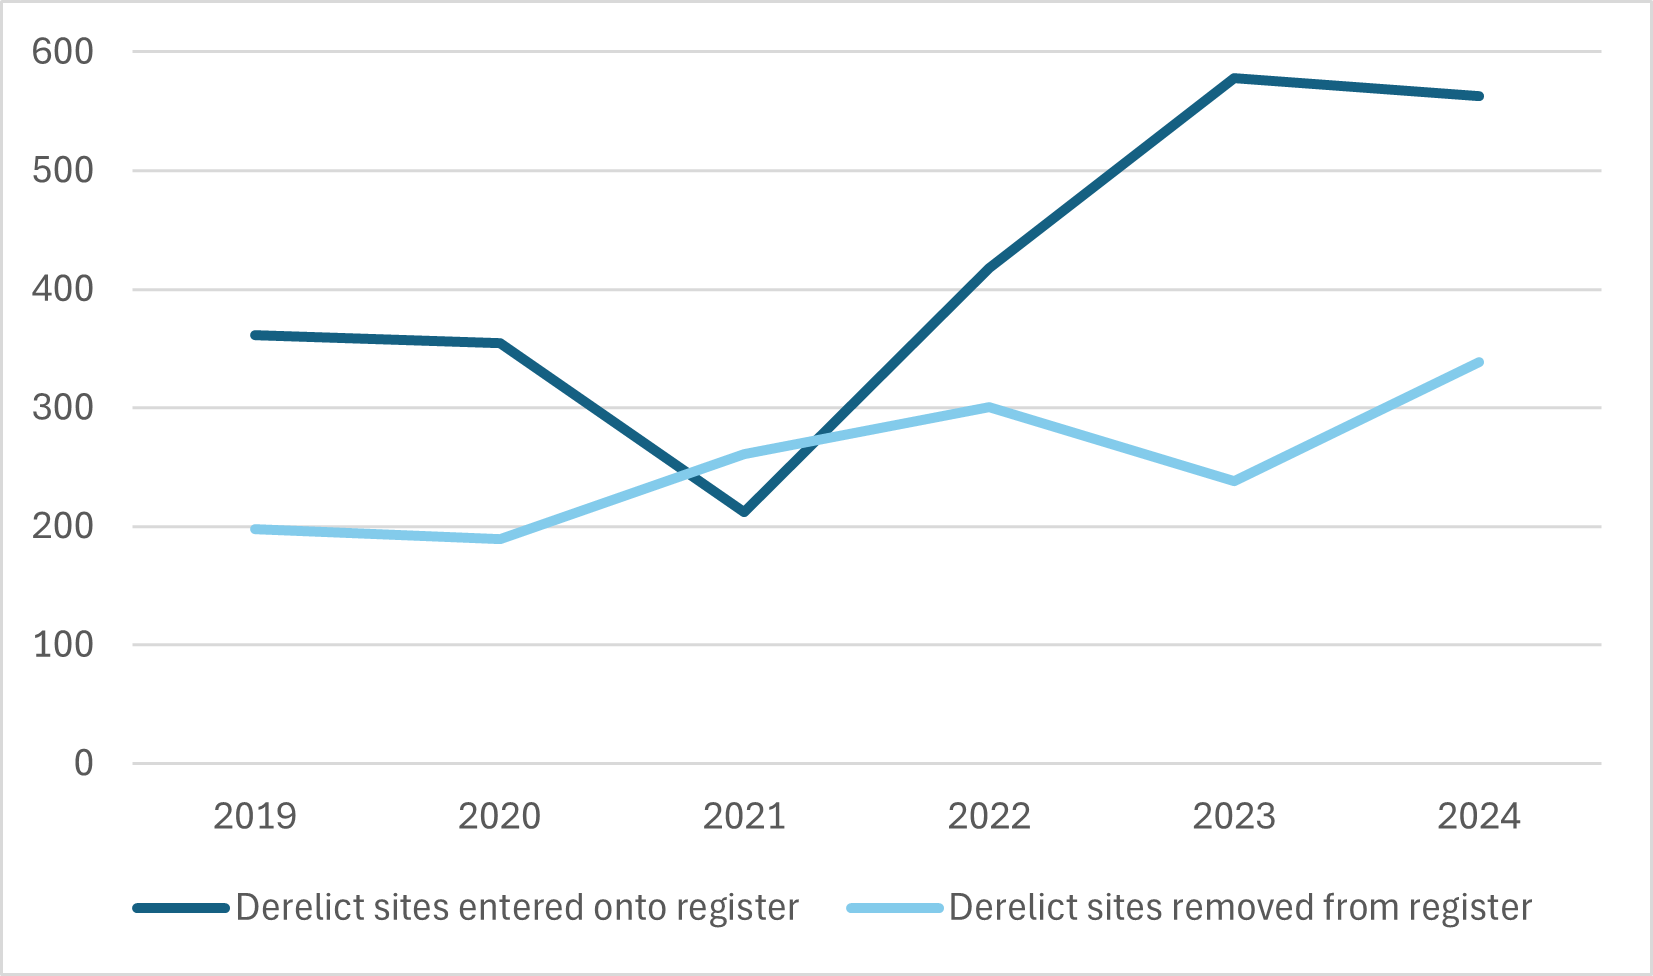
According to the register kept by the local authorities, 563 derelict sites were entered in 2024. This figure has decreased slightly (578 in 2023). A total of 339 sites were removed from the derelict sites register in 2024, which was higher than the previous year (238).
Legal Challenges
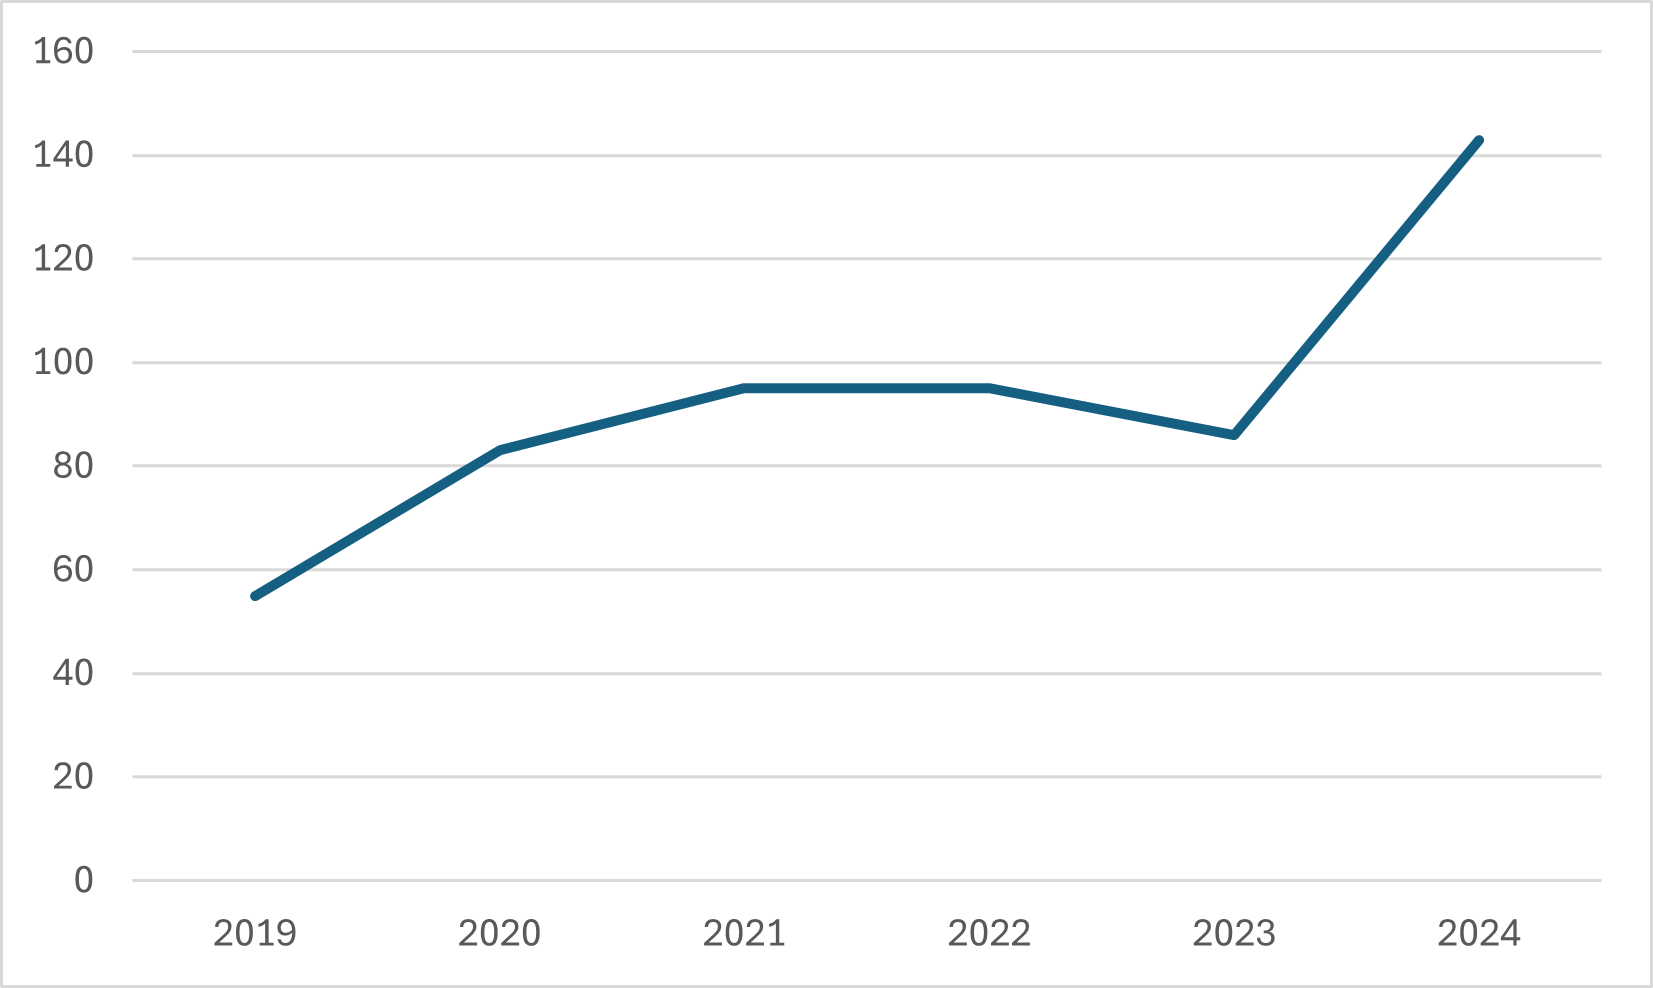
Judicial review cases taken against ACP increased significantly in 2024. There were 86 cases in 2023 and 143 cases in 2024.
Cost of Operating
Based on the latest available Amalgamated Audited Annual Financial Statements (2023), the operating costs of the 31 local authorities’ statutory planning functions were €186.2m, an increase of €14.8m from €171.4m in 2022. The operating cost increased year on year since 2018 (€140.5m). The income from planning fees has decreased from €28.8m (2022) to €28.3m (2023).
Local authority planning fee income accounted for only 15% of the overall cost of operating the planning service in 2023. This proportion was relatively stable, ranging from 16% to 18% over the previous five years.
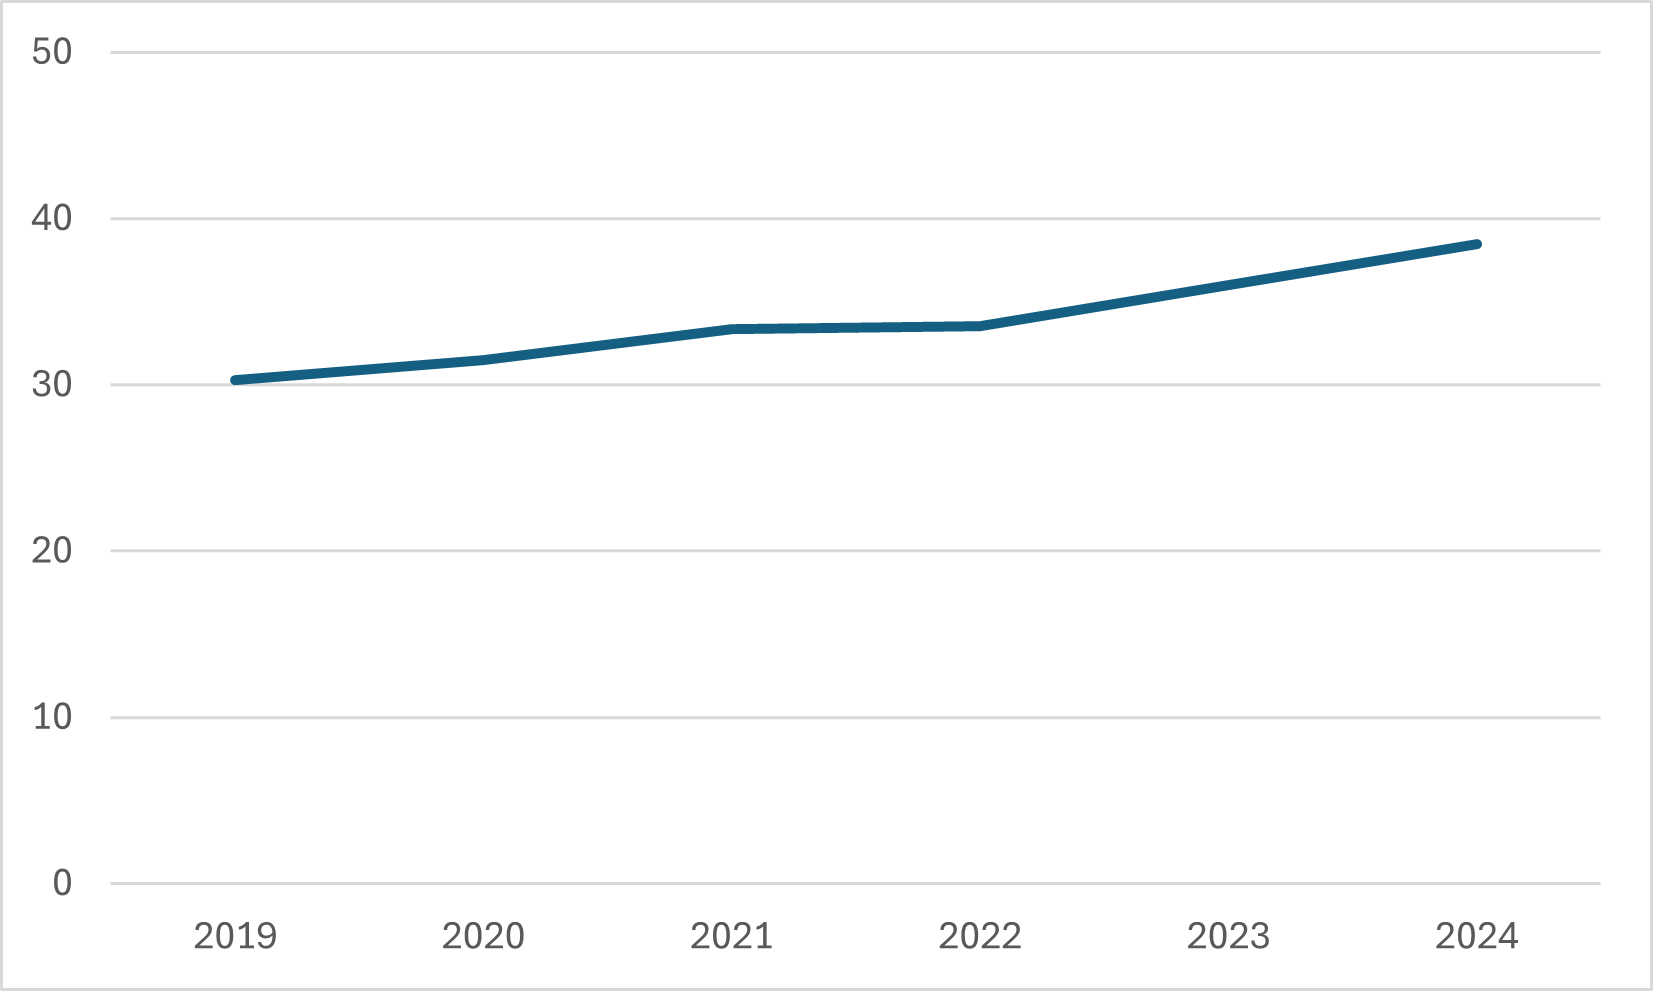
According to NOAC’s Local Authority Performance Indicator report, the average per capita cost of the planning service in 2024 was €38.47, compared with €35.97 in 2023. Cost-per-capita figures are calculated using the relevant census.
Highlights
- Dwellings are the highest category in planning permissions (63%), and the percentage in 2024 was higher than in 2023.
- In 2024, the number of granted permissions for residential units was 8,734 fewer than in 2023.
- Across the Regional Assemblies, the number of permitted residential units increased only in the NWRA.
- Dublin was the only city to experience a decrease in both the number of houses and apartments granted permission in 2024.
- In 2024, the total number of completed residential units decreased to 30,206.
- The number of appeals to ACP continued to decrease in 2024.
- The reversal rate on appeals increased in 2024.
- In 2024, local authorities investigated 7,396 new enforcement cases, exceeding the previous year’s figure.
- The number of planning enforcement investigations closed in 2024 was fewer than in 2023.
- In 2024, the number of derelict residential properties decreased slightly (from 21,947 to 20,953).
- The number of derelict sites entered into the register decreased, and the number of derelict sites moved from the register increased.
- In 2024, 4,729 Vacant Property Refurbishment Grant applications were received, fewer than in the previous year.
- In 2024, 4,366 Vacant Property Refurbishment Grant applications were approved, a significant increase from 2023.
- Judicial review cases against ACP increased from 86 in 2023 to 143 in 2024.
- The operating costs of local authorities’ statutory planning functions increased in 2023 compared to 2022.
- The income from planning fees has decreased from €28.8m (2022) to €28.3m (2023).
- Local authority planning fee income accounted for only 15% of the planning service’s total operating costs in 2023, the lowest over the six years.
- The average per-capita cost of the planning service increased in 2024.
Summary
Ireland’s planning system continues to perform its statutory duties despite increased pressure. The data presented here reflect only part of local authorities’ work; they also undertake a significant volume of additional planning-related activities, such as development promotion, urban renewal, and rural development.
It is interesting to look across the six years. This provides clarity on consistent and varying trends and figures. However, several key datasets on planning applications were unavailable, which limited the general understanding of the planning system and its functions in 2024.
The data shows the increasing cost of providing planning functions. While income from planning fees is increasing, the rate of increase is much lower. Planning fee income accounted for 15% of the overall cost of providing planning functions in 2023.
All trends presented across different datasets require careful monitoring and further consideration as the planning sector continues to evolve.
Planning, like other sectors, is facing resource constraints and seeks to leverage technological advances and related opportunities and challenges.
Reference List
The references are outlined below, and where available, the data can be obtained from the hyperlinks.
An Coimisiún Pleanála Annual Report and Accounts 2024
Central Statistics Office Planning Permissions Granted (Accessed 08.12.2025)
Central Statistics Office Planning Permissions Granted for New Houses and Apartments (Accessed 06.01.2026)
Central Statistics Office New Dwelling Completions (Accessed 08.08.2025)
Central Statistics Office Planning Permissions Granted for Non-Residential Buildings (Accessed 14.11.2025)
Department of Housing, Local Government and Heritage Derelict Sites Statistics
GeoDirectory – Derelict Sites (Accessed 16.03.2026)
National Oversight and Audit Commission Local Authority Performance Indicator Report 2024
Map of Local Authorities
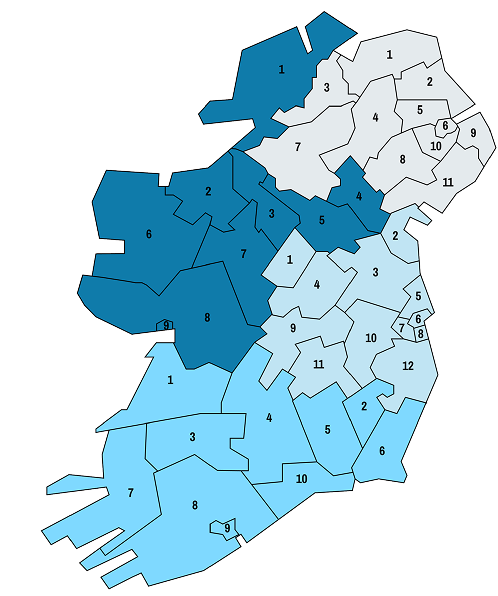
Southern Regional Assembly
- Clare
- Carlow
- Limerick City and County
- Tipperary
- Kilkenny
- Wexford
- Kerry
- Cork County
- Cork City
- Waterford City and
County
Eastern and Midland Regional Assembly
- Longford
- Louth
- Meath
- Westmeath
- Fingal
- Dublin City
- South Dublin
- Dun Laoghaire – Rathdown
- Offaly
- Kildare
- Laois
- Wicklow
Northern and Western Regional Assembly
- Donegal
- Sligo
- Leitrim
- Monaghan
- Cavan
- Mayo
- Roscommon
- Galway County
- Galway City
Local Authorities in Northern Ireland
- Causeway Coast and
Glens - Mid and East Antrim
- Derry and Strabane
- Mid Ulster
- Antrim and Newtownabbey
- Belfast
- Fermanagh and Omagh
- Armagh, Bannbridge and
Craigavon - Ards and North Down
- Lisburn and Castlereagh
- Newry, Mourne and Down